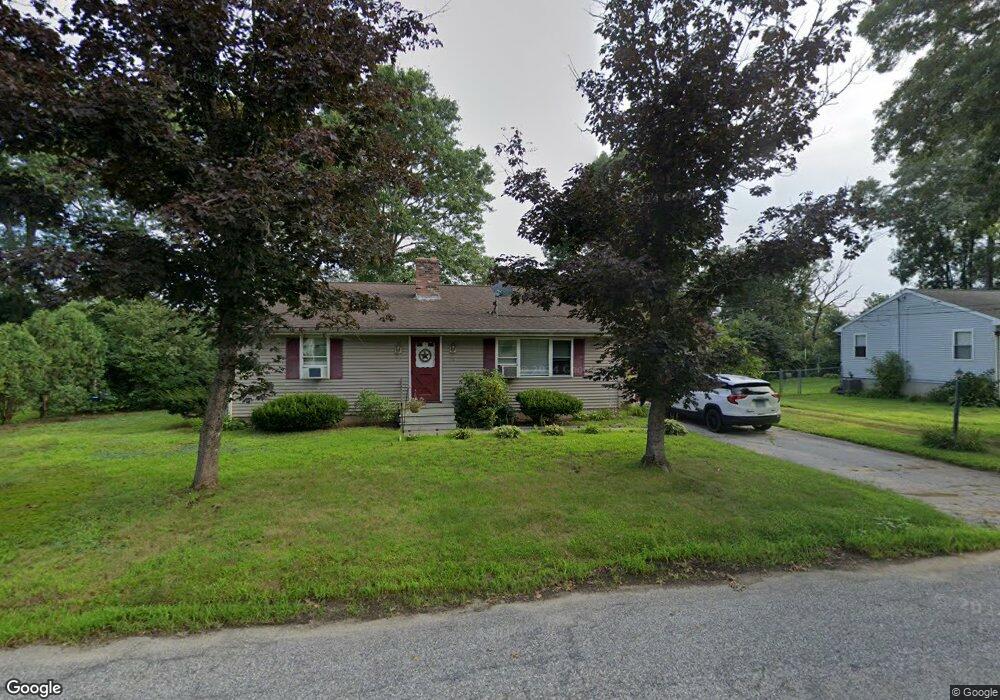
45 Chestnut St Danielson, CT 06239
Estimated Value: $300,000 - $334,000
3
Beds
1
Bath
1,120
Sq Ft
$280/Sq Ft
Est. Value
About This Home
This home is located at 45 Chestnut St, Danielson, CT 06239 and is currently estimated at $313,907, approximately $280 per square foot. 45 Chestnut St is a home located in Windham County with nearby schools including Killingly Central School, Killingly Memorial School, and Killingly Intermediate School.
Ownership History
Date
Name
Owned For
Owner Type
Purchase Details
Closed on
Jun 25, 2010
Sold by
Dpac Construction Llc
Bought by
Robitaille Eric A and Robitaille Jennifer
Current Estimated Value
Home Financials for this Owner
Home Financials are based on the most recent Mortgage that was taken out on this home.
Original Mortgage
$170,750
Outstanding Balance
$114,931
Interest Rate
4.98%
Estimated Equity
$198,976
Purchase Details
Closed on
Dec 2, 2009
Sold by
Hoar Paul D and Hoar Mary Ann
Bought by
Dpac Constr Llc
Create a Home Valuation Report for This Property
The Home Valuation Report is an in-depth analysis detailing your home's value as well as a comparison with similar homes in the area
Home Values in the Area
Average Home Value in this Area
Purchase History
| Date | Buyer | Sale Price | Title Company |
|---|---|---|---|
| Robitaille Eric A | $165,000 | -- | |
| Robitaille Eric A | $165,000 | -- | |
| Dpac Constr Llc | $120,000 | -- | |
| Dpac Constr Llc | $120,000 | -- |
Source: Public Records
Mortgage History
| Date | Status | Borrower | Loan Amount |
|---|---|---|---|
| Open | Dpac Constr Llc | $170,750 | |
| Closed | Dpac Constr Llc | $170,750 |
Source: Public Records
Tax History
| Year | Tax Paid | Tax Assessment Tax Assessment Total Assessment is a certain percentage of the fair market value that is determined by local assessors to be the total taxable value of land and additions on the property. | Land | Improvement |
|---|---|---|---|---|
| 2025 | $3,731 | $148,940 | $29,120 | $119,820 |
| 2024 | $3,561 | $148,940 | $29,120 | $119,820 |
| 2023 | $3,304 | $102,970 | $23,940 | $79,030 |
| 2022 | $3,109 | $102,970 | $23,940 | $79,030 |
| 2021 | $3,109 | $102,970 | $23,940 | $79,030 |
| 2020 | $3,057 | $102,970 | $23,940 | $79,030 |
| 2019 | $3,090 | $102,970 | $23,940 | $79,030 |
| 2017 | $2,507 | $77,700 | $15,330 | $62,370 |
| 2016 | $2,507 | $77,700 | $15,330 | $62,370 |
| 2015 | $2,456 | $77,700 | $15,330 | $62,370 |
| 2014 | $2,398 | $77,700 | $15,330 | $62,370 |
Source: Public Records
Map
Nearby Homes
- 147 South St
- 37 Cady St
- 10 Cote Dr
- 0 Allen Hill Rd Unit 24140370
- 405 Providence Rd
- 33 Junior Ave
- 454 Providence Rd
- 423 Providence Rd
- 53 S Main St
- 247 Green Hollow Rd
- 35 S Main St
- 0 Providence Rd Unit 24080985
- 20 Wauregan Rd
- 22 Jolley Rd
- 23 Tiffany St
- 43 Fall Brook Rd
- 63 Gorman Rd
- 37 Katherine Ave
- 18 Broad St
- 279 Gorman Rd
Your Personal Tour Guide
Ask me questions while you tour the home.