Estimated Value: $1,319,000 - $4,135,000
--
Bed
--
Bath
1,200
Sq Ft
$2,528/Sq Ft
Est. Value
About This Home
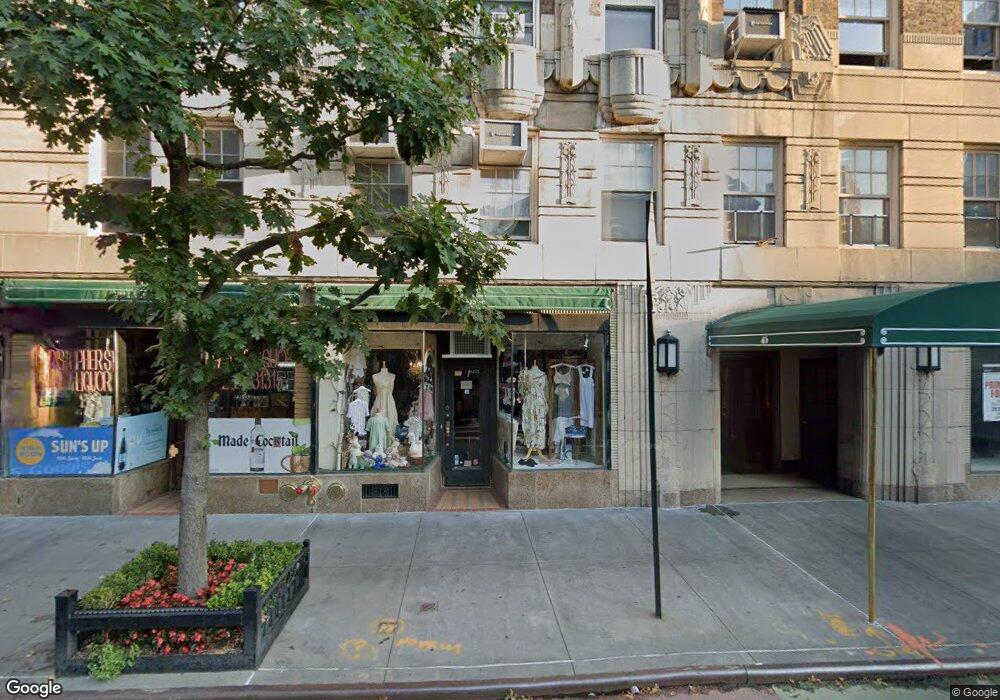
This home is located at 45 Christopher St Unit 17E, New York, NY 10014 and is currently estimated at $3,034,167, approximately $2,528 per square foot. 45 Christopher St Unit 17E is a home located in New York County with nearby schools including P.S. 41 Greenwich Village, Middle School 297, and Clinton School.
Ownership History
Date
Name
Owned For
Owner Type
Purchase Details
Closed on
Jan 30, 2020
Sold by
Budinger Peyton and % : Howland Capital Management Llc
Bought by
Charles Fulton Llc
Current Estimated Value
Purchase Details
Closed on
Oct 15, 2019
Sold by
Budinger Peyton and Budinger %
Bought by
Evans Peyton
Purchase Details
Closed on
May 7, 2010
Sold by
The William D Budinger Revocable Trust and William D Budinger Trustee
Bought by
Budinger Peyton
Purchase Details
Closed on
Apr 21, 2005
Sold by
Budinger Peyton
Bought by
Peyton Budinger Trustee and William D Budinger Trustee
Purchase Details
Closed on
Jun 1, 2000
Sold by
Park Kathryn Barrett and Park Thomas M
Bought by
Budinger Peyton
Purchase Details
Closed on
Mar 5, 1999
Sold by
Hargreaves Steven James and Hargreaves Lianne Maree
Bought by
Park Kathryn Barrett and Park Thomas M
Purchase Details
Closed on
Dec 21, 1995
Sold by
Fourth Fgp Inc
Bought by
Hargreaves Steven James and Hargreaves Lianne Maree
Create a Home Valuation Report for This Property
The Home Valuation Report is an in-depth analysis detailing your home's value as well as a comparison with similar homes in the area
Home Values in the Area
Average Home Value in this Area
Purchase History
| Date | Buyer | Sale Price | Title Company |
|---|---|---|---|
| Charles Fulton Llc | $3,937,050 | -- | |
| Charles Fulton Llc | $3,937,050 | -- | |
| Evans Peyton | -- | -- | |
| Evans Peyton | -- | -- | |
| Budinger Peyton | $2,000,000 | -- | |
| Budinger Peyton | $2,000,000 | -- | |
| Peyton Budinger Trustee | -- | -- | |
| Peyton Budinger Trustee | -- | -- | |
| Budinger Peyton | $1,400,000 | Chicago Title | |
| Budinger Peyton | $1,400,000 | Chicago Title | |
| Park Kathryn Barrett | $855,000 | -- | |
| Park Kathryn Barrett | $855,000 | -- | |
| Hargreaves Steven James | $495,000 | -- | |
| Hargreaves Steven James | $495,000 | -- |
Source: Public Records
Tax History Compared to Growth
Tax History
| Year | Tax Paid | Tax Assessment Tax Assessment Total Assessment is a certain percentage of the fair market value that is determined by local assessors to be the total taxable value of land and additions on the property. | Land | Improvement |
|---|---|---|---|---|
| 2025 | $26,348 | $227,110 | $8,796 | $218,314 |
| 2024 | $26,348 | $210,748 | $8,796 | $201,952 |
| 2023 | $24,848 | $202,559 | $8,796 | $193,763 |
| 2022 | $23,060 | $213,805 | $8,796 | $205,009 |
| 2021 | $20,859 | $170,039 | $8,796 | $161,243 |
| 2020 | $21,256 | $188,517 | $8,796 | $179,721 |
| 2019 | $20,260 | $185,522 | $8,796 | $176,726 |
| 2018 | $18,963 | $184,512 | $8,796 | $175,716 |
| 2017 | $17,544 | $147,265 | $8,796 | $138,469 |
| 2016 | $17,129 | $146,273 | $8,797 | $137,476 |
| 2015 | $9,039 | $148,235 | $8,796 | $139,439 |
| 2014 | $9,039 | $127,786 | $8,797 | $118,989 |
Source: Public Records
About This Building
Map
Nearby Homes
- 45 Christopher St Unit 12/14-F
- 45 Christopher St Unit 2E
- 193 Waverly Place
- 147 Waverly Place Unit PH
- 25 Charles St Unit 6A
- 25 Charles St Unit 3-D
- 25 Charles St Unit 4C
- 146 Waverly Place
- 52 Charles St
- 20 Charles St
- 10 Christopher St Unit 5C
- 3 Sheridan Square Unit 8M
- 3 Sheridan Square Unit 15A
- 3 Sheridan Square Unit 14E
- 3 Sheridan Square Unit 3K
- 3 Sheridan Square Unit 7G
- 9 Barrow St Unit 2J
- 9 Barrow St Unit 7B
- 9 Barrow St Unit 3H
- 136 Waverly Place Unit 6E
- 45 Christopher St Unit 9E
- 45 Christopher St Unit 5C
- 45 Christopher St Unit PHE
- 45 Christopher St Unit PHD
- 45 Christopher St Unit PHB
- 45 Christopher St Unit PHA
- 45 Christopher St Unit PHF
- 45 Christopher St Unit 17G
- 45 Christopher St Unit 17F
- 45 Christopher St Unit 17D
- 45 Christopher St Unit 17C
- 45 Christopher St Unit 17B
- 45 Christopher St Unit 17A
- 45 Christopher St Unit 16F
- 45 Christopher St Unit 16E
- 45 Christopher St Unit 16D
- 45 Christopher St Unit 16C
- 45 Christopher St Unit 16B
- 45 Christopher St Unit 16A