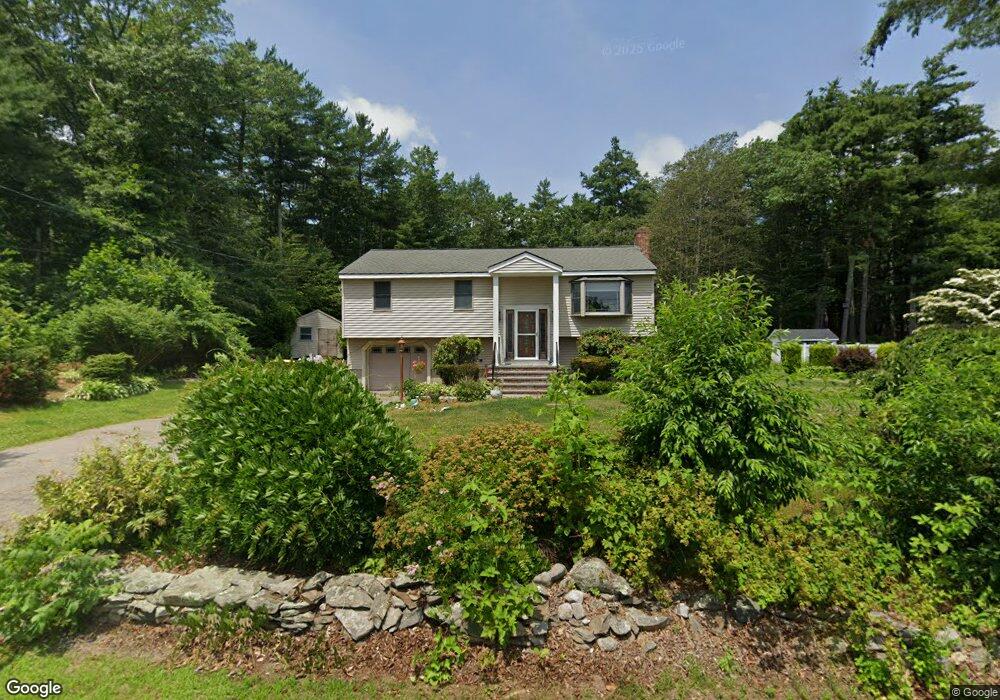
45 Conant St Bridgewater, MA 02324
Estimated Value: $565,000 - $844,000
3
Beds
2
Baths
1,532
Sq Ft
$433/Sq Ft
Est. Value
About This Home
This home is located at 45 Conant St, Bridgewater, MA 02324 and is currently estimated at $662,748, approximately $432 per square foot. 45 Conant St is a home located in Plymouth County with nearby schools including Mitchell Elementary School, Williams Intermediate School, and Bridgewater Middle School.
Ownership History
Date
Name
Owned For
Owner Type
Purchase Details
Closed on
Jan 11, 2016
Sold by
Needleman Joan and Needleman Aaron W
Bought by
Needleman Joan
Current Estimated Value
Purchase Details
Closed on
Feb 1, 1999
Sold by
Rice Barbara E
Bought by
Needleman Joan and Needleman Aaron W
Purchase Details
Closed on
Sep 28, 1988
Sold by
Cabral John S
Bought by
Rice Barbara E
Create a Home Valuation Report for This Property
The Home Valuation Report is an in-depth analysis detailing your home's value as well as a comparison with similar homes in the area
Home Values in the Area
Average Home Value in this Area
Purchase History
| Date | Buyer | Sale Price | Title Company |
|---|---|---|---|
| Needleman Joan | -- | -- | |
| Needleman Joan | $145,000 | -- | |
| Rice Barbara E | $176,000 | -- |
Source: Public Records
Mortgage History
| Date | Status | Borrower | Loan Amount |
|---|---|---|---|
| Previous Owner | Rice Barbara E | $181,500 | |
| Previous Owner | Rice Barbara E | $50,000 | |
| Previous Owner | Rice Barbara E | $118,000 |
Source: Public Records
Tax History
| Year | Tax Paid | Tax Assessment Tax Assessment Total Assessment is a certain percentage of the fair market value that is determined by local assessors to be the total taxable value of land and additions on the property. | Land | Improvement |
|---|---|---|---|---|
| 2025 | $6,625 | $560,000 | $209,500 | $350,500 |
| 2024 | $6,440 | $530,500 | $199,500 | $331,000 |
| 2023 | $6,161 | $479,800 | $186,400 | $293,400 |
| 2022 | $6,087 | $425,100 | $163,500 | $261,600 |
| 2021 | $5,395 | $372,600 | $146,000 | $226,600 |
| 2020 | $5,281 | $358,500 | $140,400 | $218,100 |
| 2019 | $5,167 | $348,400 | $140,400 | $208,000 |
| 2018 | $5,002 | $329,300 | $129,900 | $199,400 |
| 2017 | $4,809 | $308,100 | $129,900 | $178,200 |
| 2016 | $4,603 | $296,200 | $127,400 | $168,800 |
| 2015 | $4,630 | $285,100 | $123,600 | $161,500 |
| 2014 | $4,531 | $278,800 | $120,000 | $158,800 |
Source: Public Records
Map
Nearby Homes
- 35 Nelson Dr
- 425 Laurel St
- 0 Flagg St Unit 73421818
- 35 Leonard St Unit 3
- 120 Worcester St
- 220 Bedford St Unit 32
- 51 Cottage St
- 167 Spring St
- 47 Hale St
- The Fenway Plan at Duxburrow Estates
- The Deerfield Plan at Duxburrow Estates
- The Cambria Plan at Duxburrow Estates
- The Fairfield Plan at Duxburrow Estates
- The Broadway Plan at Duxburrow Estates
- The Chaves Plan at Duxburrow Estates
- The Camden Plan at Duxburrow Estates
- The Newton Grand Plan at Duxburrow Estates
- The Beacon Plan at Duxburrow Estates
- The Clarendon Plan at Duxburrow Estates
- The Berkley Plan at Duxburrow Estates
Your Personal Tour Guide
Ask me questions while you tour the home.