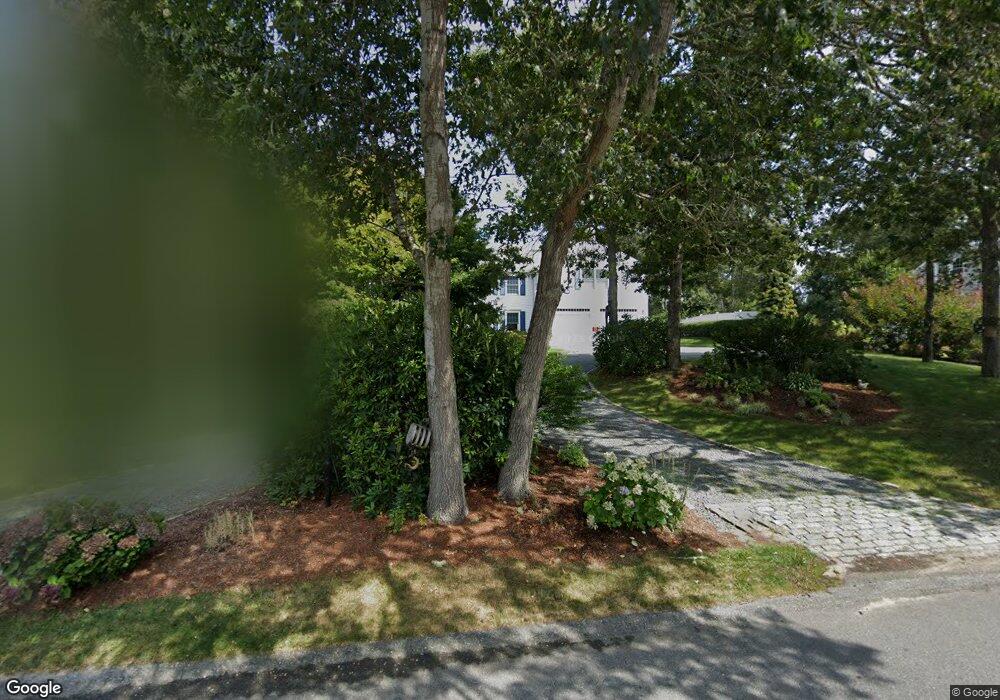
45 Deep Hole Rd Harwich Port, MA 02646
Harwich Port NeighborhoodEstimated Value: $1,695,000 - $2,265,345
5
Beds
5
Baths
3,701
Sq Ft
$567/Sq Ft
Est. Value
About This Home
This home is located at 45 Deep Hole Rd, Harwich Port, MA 02646 and is currently estimated at $2,098,586, approximately $567 per square foot. 45 Deep Hole Rd is a home located in Barnstable County with nearby schools including Harwich Elementary School, Chatham Elementary School, and Monomoy Regional Middle School.
Ownership History
Date
Name
Owned For
Owner Type
Purchase Details
Closed on
Oct 19, 2018
Sold by
Corbett Charles M and Corbett Carol M
Bought by
Corbett Ft
Current Estimated Value
Purchase Details
Closed on
May 29, 2003
Sold by
Cuddy Mary Beth H
Bought by
Corbett Charles M and Corbett Carol M
Home Financials for this Owner
Home Financials are based on the most recent Mortgage that was taken out on this home.
Original Mortgage
$600,000
Interest Rate
5.86%
Mortgage Type
Purchase Money Mortgage
Purchase Details
Closed on
Apr 12, 1999
Sold by
Connell Laura A
Bought by
Cuddy Marybeth H and Trudeau Michael
Home Financials for this Owner
Home Financials are based on the most recent Mortgage that was taken out on this home.
Original Mortgage
$388,000
Interest Rate
6.83%
Mortgage Type
Purchase Money Mortgage
Purchase Details
Closed on
Dec 15, 1998
Sold by
Knight Nt and Knight Tr Craig
Bought by
Connell Laura A
Home Financials for this Owner
Home Financials are based on the most recent Mortgage that was taken out on this home.
Original Mortgage
$120,000
Interest Rate
6.8%
Mortgage Type
Purchase Money Mortgage
Purchase Details
Closed on
Dec 22, 1995
Sold by
Murrah Kenneth F and Robinson Herbert O
Bought by
Knight Nt and Knight Graig
Create a Home Valuation Report for This Property
The Home Valuation Report is an in-depth analysis detailing your home's value as well as a comparison with similar homes in the area
Home Values in the Area
Average Home Value in this Area
Purchase History
| Date | Buyer | Sale Price | Title Company |
|---|---|---|---|
| Corbett Ft | -- | -- | |
| Corbett Charles M | $850,000 | -- | |
| Cuddy Marybeth H | $185,300 | -- | |
| Connell Laura A | $150,000 | -- | |
| Knight Nt | $120,000 | -- |
Source: Public Records
Mortgage History
| Date | Status | Borrower | Loan Amount |
|---|---|---|---|
| Previous Owner | Corbett Charles M | $600,000 | |
| Previous Owner | Cuddy Marybeth H | $388,000 | |
| Previous Owner | Connell Laura A | $120,000 | |
| Closed | Connell Laura A | $21,000 |
Source: Public Records
Tax History Compared to Growth
Tax History
| Year | Tax Paid | Tax Assessment Tax Assessment Total Assessment is a certain percentage of the fair market value that is determined by local assessors to be the total taxable value of land and additions on the property. | Land | Improvement |
|---|---|---|---|---|
| 2025 | $11,296 | $1,911,300 | $704,100 | $1,207,200 |
| 2024 | $10,115 | $1,677,400 | $664,300 | $1,013,100 |
| 2023 | $9,728 | $1,465,100 | $603,900 | $861,200 |
| 2022 | $9,649 | $1,189,800 | $525,200 | $664,600 |
| 2021 | $9,754 | $1,134,200 | $477,400 | $656,800 |
| 2020 | $9,739 | $1,115,600 | $470,000 | $645,600 |
| 2019 | $9,332 | $1,076,300 | $451,700 | $624,600 |
| 2018 | $8,994 | $992,300 | $410,600 | $581,700 |
| 2017 | $8,607 | $959,500 | $374,200 | $585,300 |
| 2016 | $8,474 | $934,300 | $374,200 | $560,100 |
| 2015 | $8,171 | $910,900 | $366,800 | $544,100 |
| 2014 | $7,811 | $890,700 | $355,900 | $534,800 |
Source: Public Records
Map
Nearby Homes
- 8 Old Wharf Rd
- 820 Massachusetts 28
- 252 Chatham Rd
- 27 Quaker Ln
- 27 Fairview Dr
- 1011 Massachusetts 28 Unit C-6
- 1011 Route 28 Unit 6
- 41 Woodland Rd
- 42 Marthas Ln
- 6 Marthas Ln
- 72 Forest Beach Rd
- 72 Forest Beach Rd
- Lot 6 Bobbie's Ln
- 79 Forest Beach Rd
- 53 Freeman St
- 106 Chatham Rd
- 9 Jason Ln
- 2550 Main St
- 2548 Main St
- 21 Princes St