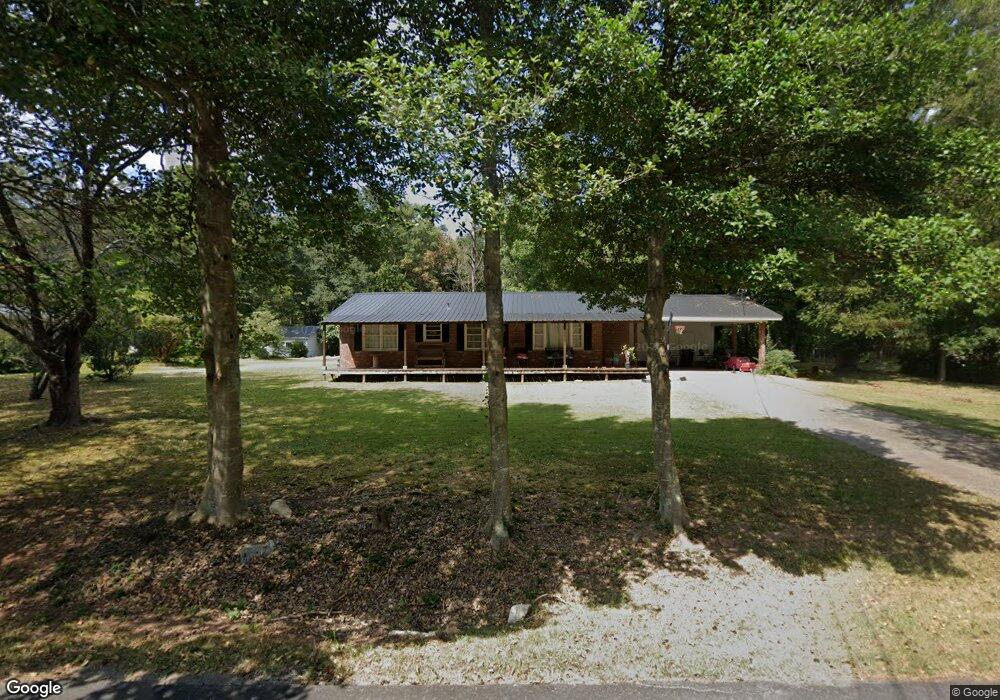
45 Dixie Meadow Ln Carrollton, GA 30117
Estimated Value: $233,121 - $268,000
3
Beds
2
Baths
1,356
Sq Ft
$187/Sq Ft
Est. Value
About This Home
This home is located at 45 Dixie Meadow Ln, Carrollton, GA 30117 and is currently estimated at $253,780, approximately $187 per square foot. 45 Dixie Meadow Ln is a home located in Carroll County with nearby schools including Central Elementary School, Central Middle School, and Central High School.
Ownership History
Date
Name
Owned For
Owner Type
Purchase Details
Closed on
Jan 17, 2024
Sold by
Ploof Jamey D
Bought by
Ploof Jamey D and Ploof Olivia
Current Estimated Value
Purchase Details
Closed on
Jul 19, 2019
Sold by
Heard Philip S
Bought by
Ploof Olivia
Purchase Details
Closed on
May 13, 2008
Sold by
Heard Philip S
Bought by
Heard Wortham L and Heard Charles L
Purchase Details
Closed on
Apr 2, 2008
Sold by
Heard Wortham L
Bought by
Heard Philip S and Heard Shirley
Purchase Details
Closed on
Mar 31, 2008
Sold by
Heard Wortham Lanier
Bought by
Heard Mabel Wortham
Purchase Details
Closed on
Feb 17, 2008
Sold by
Heard Charles L
Bought by
Heard Philip S
Create a Home Valuation Report for This Property
The Home Valuation Report is an in-depth analysis detailing your home's value as well as a comparison with similar homes in the area
Home Values in the Area
Average Home Value in this Area
Purchase History
| Date | Buyer | Sale Price | Title Company |
|---|---|---|---|
| Ploof Jamey D | -- | -- | |
| Ploof Olivia | -- | -- | |
| Heard Wortham L | -- | -- | |
| Heard Philip S | -- | -- | |
| Heard Mabel Wortham | -- | -- | |
| Heard Philip S | -- | -- |
Source: Public Records
Tax History Compared to Growth
Tax History
| Year | Tax Paid | Tax Assessment Tax Assessment Total Assessment is a certain percentage of the fair market value that is determined by local assessors to be the total taxable value of land and additions on the property. | Land | Improvement |
|---|---|---|---|---|
| 2024 | $1,508 | $70,643 | $4,700 | $65,943 |
| 2023 | $1,508 | $64,707 | $4,700 | $60,007 |
| 2022 | $1,326 | $52,873 | $4,700 | $48,173 |
| 2021 | $1,181 | $46,068 | $4,700 | $41,368 |
| 2020 | $1,076 | $41,927 | $4,700 | $37,227 |
| 2019 | $998 | $38,546 | $4,700 | $33,846 |
| 2018 | $929 | $35,374 | $4,700 | $30,674 |
| 2017 | $932 | $35,374 | $4,700 | $30,674 |
| 2016 | $932 | $35,374 | $4,700 | $30,674 |
| 2015 | $707 | $25,265 | $6,000 | $19,265 |
| 2014 | $709 | $25,265 | $6,000 | $19,265 |
Source: Public Records
Map
Nearby Homes
- 135 Gray Rd
- 400 Stripling Chapel Rd
- 605 Whooping Creek Rd
- 977 Whooping Creek Rd
- 2492 Oak Grove Church Rd
- 50 Azalea Trail
- 587 Whooping Creek Rd
- 420 Whooping Creek Rd
- 221 Valley Ridge Dr
- 1585 Hays Mill Rd
- 472 Carrie Kathleen Terrace
- 484 Carrie Kathleen Terrace
- 1250 Hays Mill Rd
- 1915 Whooping Creek Church Rd
- 111 Vineyard Walk
- 111 Vineyard Walk Unit LOT 78
- 113 Vineyard Walk
- 45 Dixie Meadow Ln
- 35 Dixie Meadow Ln
- 55 Dixie Meadow Ln
- 30 Dixie Meadow Ln
- 56 Dixie Meadow Ln
- 10 Dixie Meadow Ln
- 10 Dixie Meadow Ln
- 70 Dixie Meadow Ln
- 2301 S Highway 27
- 85 Dixie Meadow Ln
- 70 Dixie Meadow Ln
- 2249 Us Highway 27
- 2249 S Highway 27
- 30 W Triple Tree Dr
- 60 W Triple Tree Dr
- 10 W Triple Tree Dr
- 105 Dixie Meadow Ln
- 2294 Us Highway 27
- 80 W Triple Tree Dr
- 2294 S Highway 27