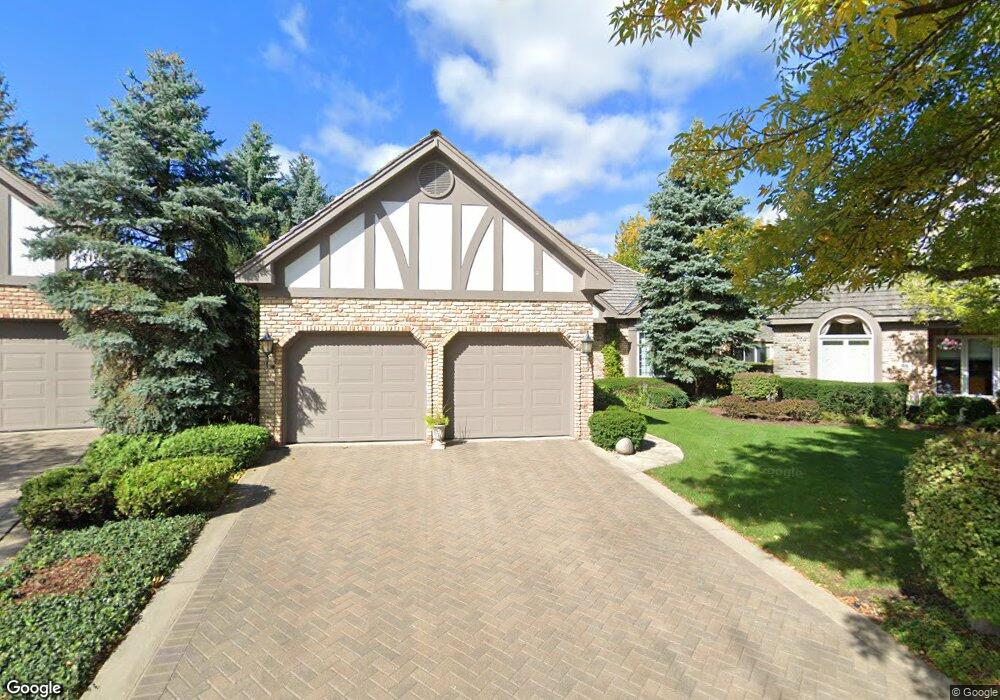
45 Durham Ct Burr Ridge, IL 60527
Burr Ridge West NeighborhoodEstimated Value: $727,770 - $962,000
3
Beds
3
Baths
2,380
Sq Ft
$358/Sq Ft
Est. Value
About This Home
This home is located at 45 Durham Ct, Burr Ridge, IL 60527 and is currently estimated at $853,193, approximately $358 per square foot. 45 Durham Ct is a home located in DuPage County with nearby schools including Gower West Elementary School, Gower Middle School, and Hinsdale South High School.
Ownership History
Date
Name
Owned For
Owner Type
Purchase Details
Closed on
Jul 9, 2019
Sold by
Steigerwald Rita M and Steigerwald Karl A
Bought by
Steigerwald Karl A and Steigerwald Rita M
Current Estimated Value
Purchase Details
Closed on
Oct 12, 2007
Sold by
Everman Kathryn Anne and Everman Sharyn Anne
Bought by
The Rita M Stelgerwald Living Trust
Purchase Details
Closed on
Jun 24, 1996
Sold by
Everman Frank R and Everman Olga
Bought by
F Richard Everman Trust and Olga Everman Trust
Home Financials for this Owner
Home Financials are based on the most recent Mortgage that was taken out on this home.
Original Mortgage
$207,000
Interest Rate
6.12%
Mortgage Type
Purchase Money Mortgage
Purchase Details
Closed on
Jun 4, 1996
Sold by
Callaghan Associates Inc
Bought by
Everman Frank R and Everman Olga
Home Financials for this Owner
Home Financials are based on the most recent Mortgage that was taken out on this home.
Original Mortgage
$207,000
Interest Rate
6.12%
Mortgage Type
Purchase Money Mortgage
Create a Home Valuation Report for This Property
The Home Valuation Report is an in-depth analysis detailing your home's value as well as a comparison with similar homes in the area
Home Values in the Area
Average Home Value in this Area
Purchase History
| Date | Buyer | Sale Price | Title Company |
|---|---|---|---|
| Steigerwald Karl A | -- | Attorney | |
| The Rita M Stelgerwald Living Trust | $745,000 | First American Title | |
| F Richard Everman Trust | -- | First American Title | |
| F Richard Everman Trust | -- | -- | |
| Everman Frank R | $413,500 | -- |
Source: Public Records
Mortgage History
| Date | Status | Borrower | Loan Amount |
|---|---|---|---|
| Previous Owner | Everman Frank R | $207,000 |
Source: Public Records
Tax History Compared to Growth
Tax History
| Year | Tax Paid | Tax Assessment Tax Assessment Total Assessment is a certain percentage of the fair market value that is determined by local assessors to be the total taxable value of land and additions on the property. | Land | Improvement |
|---|---|---|---|---|
| 2024 | $10,423 | $228,667 | $54,597 | $174,070 |
| 2023 | $9,958 | $210,210 | $50,190 | $160,020 |
| 2022 | $9,927 | $207,920 | $49,640 | $158,280 |
| 2021 | $9,546 | $205,560 | $49,080 | $156,480 |
| 2020 | $9,410 | $201,490 | $48,110 | $153,380 |
| 2019 | $10,069 | $213,980 | $46,160 | $167,820 |
| 2018 | $9,304 | $205,750 | $44,380 | $161,370 |
| 2017 | $9,227 | $197,990 | $42,710 | $155,280 |
| 2016 | $9,002 | $188,960 | $40,760 | $148,200 |
| 2015 | $8,939 | $177,780 | $38,350 | $139,430 |
| 2014 | $9,114 | $178,200 | $38,440 | $139,760 |
| 2013 | $8,897 | $177,370 | $38,260 | $139,110 |
Source: Public Records
Map
Nearby Homes
- 55 Chesterfield Ct
- 8094 S Garfield Ave Unit 4-3
- 7990 S Garfield Ave Unit 14-3
- 15W749 79th St
- 7978 S Garfield Ave Unit 206
- 7962 S Garfield Ave Unit 110
- 15W670 83rd St
- 219 79th St
- 9S174 Drew Ave
- 817 Lakeview Ln
- 8101 S County Line Rd
- 1 Hidden Lake Dr
- 7339 S Park Ave
- 16W130 89th St
- 7715 Virginia Ct
- 124 Sunrise Ave
- 8625 Meadowbrook Dr
- 8120 Woodside Ln
- 7213 Giddings Ave
- 7925 William Dr
- 44 Durham Ct
- 46 Durham Ct
- 47 Durham Ct
- 43 Durham Ct
- 9 Bristol Ct
- 42 Durham Ct
- 10 Bristol Ct
- 15 Lake Ridge Club Ct
- 16 Lake Ridge Club Ct Unit 486
- 8 Bristol Ct
- 14 Lake Ridge Club Ct
- 11 Bristol Ct
- 41 Durham Ct
- 48 Chesterfield Ct
- 17 Lake Ridge Club Ct
- 40 Durham Ct
- 7 Bristol Ct
- 13 Lake Ridge Club Ct
- 39 Lancaster Ct
- 49 Chesterfield Ct