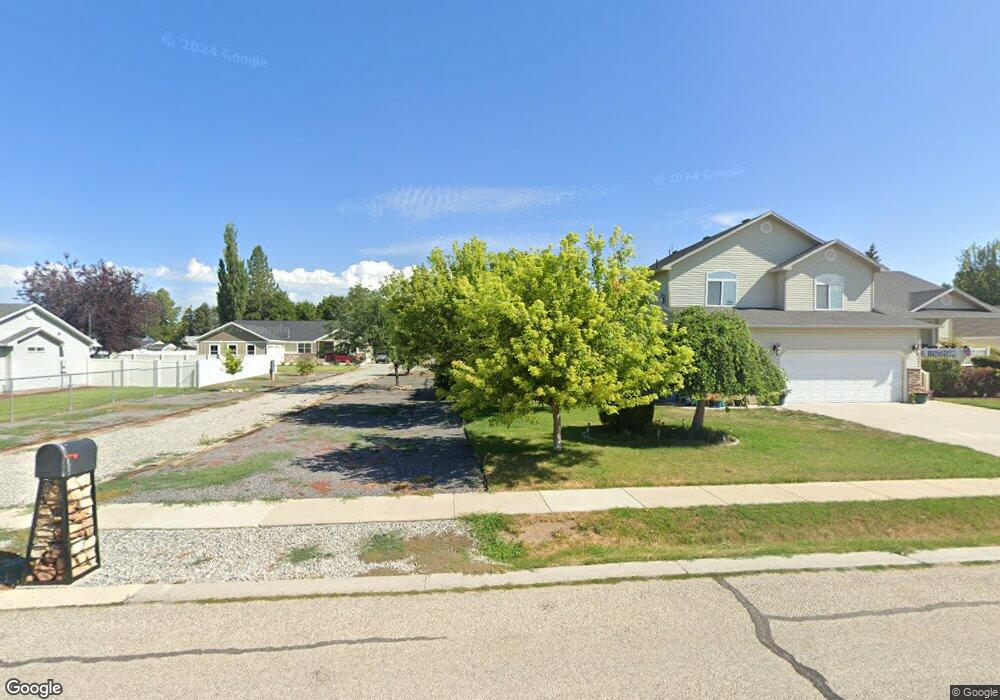
45 E 7th S Preston, ID 83263
Estimated Value: $523,000 - $811,332
3
Beds
3
Baths
2,504
Sq Ft
$259/Sq Ft
Est. Value
About This Home
This home is located at 45 E 7th S, Preston, ID 83263 and is currently estimated at $648,333, approximately $258 per square foot. 45 E 7th S is a home located in Franklin County with nearby schools including Oakwood Elementary School, Pioneer Elementary School, and Preston Junior High School.
Ownership History
Date
Name
Owned For
Owner Type
Purchase Details
Closed on
Jun 10, 2024
Sold by
Gittins Jay and Gittins Coleen
Bought by
Gittins Property Protection Trust and Gittins
Current Estimated Value
Purchase Details
Closed on
Oct 30, 2023
Sold by
Golightly Jacob and Golightly Anna
Bought by
Gittins Jay and Gittins Coleen
Purchase Details
Closed on
Mar 4, 2021
Sold by
Golightly Jacob and Golightly Anna
Bought by
Golightly Jacob and Golightly Anna
Home Financials for this Owner
Home Financials are based on the most recent Mortgage that was taken out on this home.
Original Mortgage
$227,250
Interest Rate
2.7%
Mortgage Type
New Conventional
Purchase Details
Closed on
Jan 31, 2020
Sold by
Golightly Jacob B
Bought by
Golightly Jacob B and Golightly Anna
Purchase Details
Closed on
Feb 17, 2015
Sold by
Aseona Kelly G and Ascona Sulma A
Bought by
Golightly Jacob B
Home Financials for this Owner
Home Financials are based on the most recent Mortgage that was taken out on this home.
Original Mortgage
$60,000
Interest Rate
3.66%
Mortgage Type
Future Advance Clause Open End Mortgage
Create a Home Valuation Report for This Property
The Home Valuation Report is an in-depth analysis detailing your home's value as well as a comparison with similar homes in the area
Home Values in the Area
Average Home Value in this Area
Purchase History
| Date | Buyer | Sale Price | Title Company |
|---|---|---|---|
| Gittins Property Protection Trust | -- | None Listed On Document | |
| Gittins Jay | -- | Northern Title Company | |
| Golightly Jacob | -- | Northern Title | |
| Golightly Jacob B | -- | Northern Title | |
| Golightly Jacob B | -- | Northern Title |
Source: Public Records
Mortgage History
| Date | Status | Borrower | Loan Amount |
|---|---|---|---|
| Previous Owner | Golightly Jacob | $227,250 | |
| Previous Owner | Golightly Jacob B | $60,000 |
Source: Public Records
Tax History
| Year | Tax Paid | Tax Assessment Tax Assessment Total Assessment is a certain percentage of the fair market value that is determined by local assessors to be the total taxable value of land and additions on the property. | Land | Improvement |
|---|---|---|---|---|
| 2025 | $2,512 | $490,570 | $78,100 | $412,470 |
| 2024 | $2,661 | $490,570 | $78,100 | $412,470 |
| 2023 | $2,506 | $493,880 | $78,100 | $415,780 |
| 2022 | $3,296 | $467,812 | $52,032 | $415,780 |
| 2021 | $755 | $74,732 | $52,032 | $22,700 |
| 2020 | $775 | $76,582 | $52,032 | $24,550 |
| 2019 | $957 | $76,582 | $52,032 | $24,550 |
| 2018 | $754 | $57,782 | $33,232 | $24,550 |
| 2017 | $781 | $57,782 | $33,232 | $24,550 |
| 2016 | $484 | $66,464 | $33,232 | $33,232 |
| 2015 | $413 | $66,578 | $33,232 | $33,346 |
| 2014 | $7,572 | $33,346 | $33,346 | $0 |
| 2013 | $6,535 | $33,350 | $33,350 | $0 |
Source: Public Records
Map
Nearby Homes
Your Personal Tour Guide
Ask me questions while you tour the home.