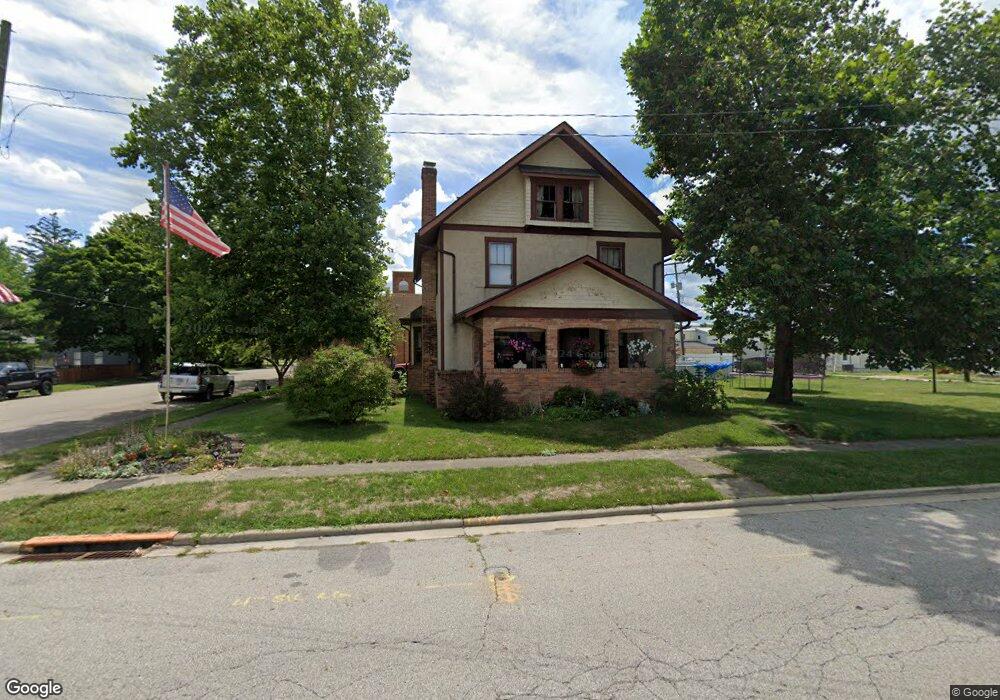
45 E Main St Mount Sterling, OH 43143
Estimated Value: $196,000 - $245,423
3
Beds
2
Baths
1,974
Sq Ft
$110/Sq Ft
Est. Value
About This Home
This home is located at 45 E Main St, Mount Sterling, OH 43143 and is currently estimated at $218,106, approximately $110 per square foot. 45 E Main St is a home located in Madison County with nearby schools including Madison-Plains Elementary School, Madison-Plains Intermediate School, and Madison-Plains Junior High School.
Ownership History
Date
Name
Owned For
Owner Type
Purchase Details
Closed on
Mar 21, 2007
Sold by
Va
Bought by
Underwood Adam L and Underwood Kimberly S
Current Estimated Value
Home Financials for this Owner
Home Financials are based on the most recent Mortgage that was taken out on this home.
Original Mortgage
$92,150
Outstanding Balance
$54,193
Interest Rate
6.2%
Mortgage Type
Purchase Money Mortgage
Estimated Equity
$163,913
Purchase Details
Closed on
Oct 10, 2006
Sold by
Drewniak Pamela A
Bought by
Va
Purchase Details
Closed on
Jul 2, 2001
Sold by
Armstrong Phyllis
Bought by
Drewniak Pamela
Home Financials for this Owner
Home Financials are based on the most recent Mortgage that was taken out on this home.
Original Mortgage
$110,160
Interest Rate
7.18%
Mortgage Type
VA
Create a Home Valuation Report for This Property
The Home Valuation Report is an in-depth analysis detailing your home's value as well as a comparison with similar homes in the area
Purchase History
| Date | Buyer | Sale Price | Title Company |
|---|---|---|---|
| Underwood Adam L | -- | Chicago Title | |
| Va | $66,979 | None Available | |
| Drewniak Pamela | $108,000 | -- |
Source: Public Records
Mortgage History
| Date | Status | Borrower | Loan Amount |
|---|---|---|---|
| Open | Underwood Adam L | $92,150 | |
| Previous Owner | Drewniak Pamela | $110,160 |
Source: Public Records
Tax History
| Year | Tax Paid | Tax Assessment Tax Assessment Total Assessment is a certain percentage of the fair market value that is determined by local assessors to be the total taxable value of land and additions on the property. | Land | Improvement |
|---|---|---|---|---|
| 2025 | $2,048 | $58,500 | $11,670 | $46,830 |
| 2024 | $2,048 | $58,500 | $11,670 | $46,830 |
| 2023 | $2,048 | $58,500 | $11,670 | $46,830 |
| 2022 | $1,680 | $45,340 | $9,040 | $36,300 |
| 2021 | $1,637 | $45,340 | $9,040 | $36,300 |
| 2020 | $1,639 | $45,340 | $9,040 | $36,300 |
| 2019 | $1,405 | $39,990 | $8,090 | $31,900 |
| 2018 | $1,405 | $39,990 | $8,090 | $31,900 |
| 2017 | $1,377 | $39,990 | $8,090 | $31,900 |
| 2016 | $1,155 | $34,890 | $8,090 | $26,800 |
| 2015 | $1,156 | $34,890 | $8,090 | $26,800 |
| 2014 | $1,133 | $34,890 | $8,090 | $26,800 |
| 2013 | -- | $34,920 | $8,780 | $26,140 |
Source: Public Records
Map
Nearby Homes
- 121 New St
- 129 W Columbus St
- 103 Valleyview Dr
- 231 N London St
- 230 W Columbus St
- 178 Poplar St
- 543 Wingate Place
- 14690 West St
- 14659 State Route 56 SE
- 16185 State Route 207
- 11560 McClimansville Cemetery Rd
- 15561 Blain Rd
- 13790 Era Rd
- 13360 U S 62
- 0 Clarks Run Rd
- 15014 Five Points Pike
- 16270 Cook Yankeetown Rd NE
- 0 Federal Rd
- 17161 Five Points Pike
- 12281 London Rd
- 27 E Main St
- 63 E Main St
- 12 S High St
- 17 E Main St
- 48 E Main St
- 26 E Main St
- 18 S London St
- 20 S High St
- 28 E Main St
- 28 E Columbus St
- 20 E Main St
- 14 E Main St
- 73 E Main St
- 48 E Columbus St
- 15 N High St
- 46 E Columbus St
- 62 E Main St
- 0 U S Highway 62 Unit 2428570
- 0 U S Highway 62 Unit 2417250
- 0 U S Highway 62 Unit 2333240
Your Personal Tour Guide
Ask me questions while you tour the home.