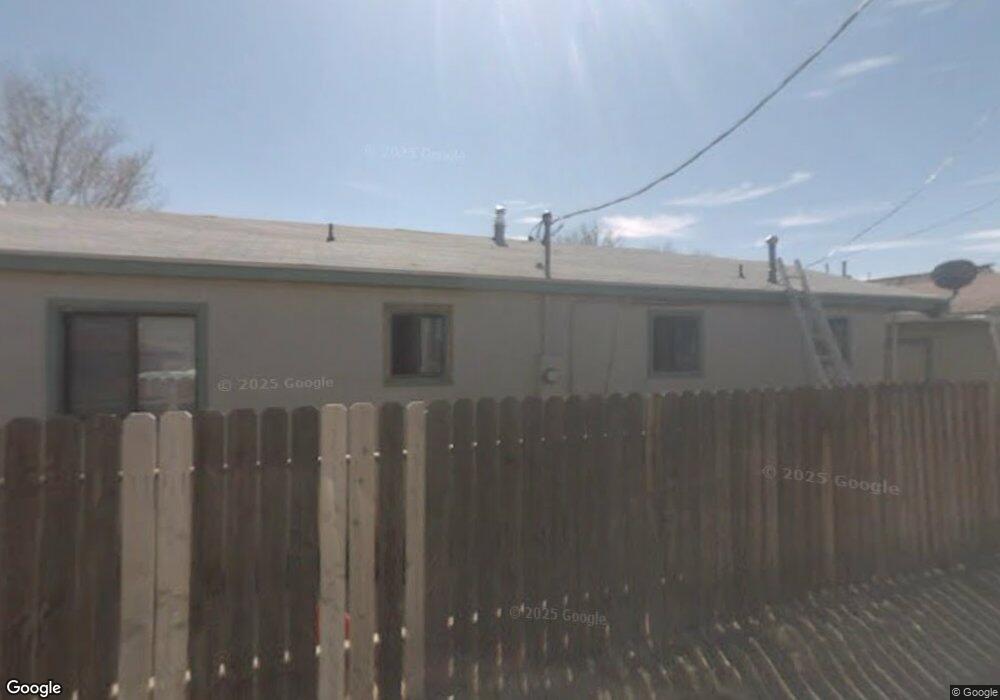
45 E Shepard St Winnemucca, NV 89445
Estimated Value: $246,516 - $331,000
Studio
2
Baths
1,458
Sq Ft
$200/Sq Ft
Est. Value
About This Home
This home is located at 45 E Shepard St, Winnemucca, NV 89445 and is currently estimated at $292,129, approximately $200 per square foot. 45 E Shepard St is a home located in Humboldt County with nearby schools including Sonoma Heights Elementary School, Winnemucca Junior High School, and French Ford Middle School.
Ownership History
Date
Name
Owned For
Owner Type
Purchase Details
Closed on
Jun 1, 2012
Sold by
Vazquez Maestela
Bought by
Vazquez Jose A
Current Estimated Value
Home Financials for this Owner
Home Financials are based on the most recent Mortgage that was taken out on this home.
Original Mortgage
$94,300
Interest Rate
3.84%
Mortgage Type
FHA
Purchase Details
Closed on
Apr 6, 2012
Sold by
Federal National Mortgage Association
Bought by
Vasquez Jose A
Home Financials for this Owner
Home Financials are based on the most recent Mortgage that was taken out on this home.
Original Mortgage
$94,300
Interest Rate
3.84%
Mortgage Type
FHA
Purchase Details
Closed on
Feb 7, 2012
Sold by
Klegseth Danny L
Bought by
Federal National Mortgage Association
Home Financials for this Owner
Home Financials are based on the most recent Mortgage that was taken out on this home.
Original Mortgage
$94,300
Interest Rate
3.84%
Mortgage Type
FHA
Create a Home Valuation Report for This Property
The Home Valuation Report is an in-depth analysis detailing your home's value as well as a comparison with similar homes in the area
Purchase History
| Date | Buyer | Sale Price | Title Company |
|---|---|---|---|
| Vazquez Jose A | -- | First American Title Reno | |
| Vasquez Jose A | $97,400 | First American Title Reno | |
| Federal National Mortgage Association | $136,547 | None Available |
Source: Public Records
Mortgage History
| Date | Status | Borrower | Loan Amount |
|---|---|---|---|
| Previous Owner | Vasquez Jose A | $94,300 |
Source: Public Records
Tax History
| Year | Tax Paid | Tax Assessment Tax Assessment Total Assessment is a certain percentage of the fair market value that is determined by local assessors to be the total taxable value of land and additions on the property. | Land | Improvement |
|---|---|---|---|---|
| 2025 | $962 | $31,071 | $10,850 | $20,221 |
| 2024 | $937 | $31,080 | $10,850 | $20,230 |
| 2023 | $937 | $27,692 | $9,100 | $18,592 |
| 2022 | $889 | $24,627 | $9,100 | $15,527 |
| 2021 | $877 | $24,243 | $9,100 | $15,143 |
| 2020 | $875 | $24,260 | $9,100 | $15,160 |
| 2019 | $853 | $23,475 | $9,100 | $14,375 |
| 2018 | $857 | $23,608 | $9,100 | $14,508 |
| 2017 | $872 | $24,086 | $9,100 | $14,986 |
| 2016 | $914 | $25,321 | $9,100 | $16,221 |
| 2015 | $908 | $24,835 | $9,100 | $15,735 |
| 2014 | $908 | $24,972 | $9,100 | $15,872 |
Source: Public Records
Map
Nearby Homes
- TBD E Haskell St
- 1385 S Bridge St
- 15 Rd
- 502 Prebble St
- 3 Colado Ct
- 133 W 1st St
- 99 W 4th St
- 136 W 1st St
- 0 4th St Unit 230000686
- 609 Sheehan St
- 1823 Pearce St
- 1767 Scott St
- 1883 Midas Dr
- Hwy 95 North U S Route 95
- 4325 Warmoth Ln
- 0 E 2nd St
- 5270 Marla Dr Unit 14
- 3205 N Sherwood Dr
- 290 Paradise Ave
- 3285 Marla Dr
- 25 E Shepard St
- 851 Harmony Rd
- 838 Harmony Rd
- 46 E Shepard St
- 36 E Shepard St
- 42 E Shepard St
- 1725 S Bridge St
- 1955 S Bridge St
- 10 E Shepard St
- 810 S Bridge St
- 834 S Bridge St
- 33 W Haskell St
- 904 S Bridge St
- 939 S Bridge St
- 32 W Shepard St
- 35 W Haskell St
- 50 W Shepard St Unit 8
- 50 W Shepard St
- 93 E Bell St
- 39 W Haskell St
Your Personal Tour Guide
Ask me questions while you tour the home.