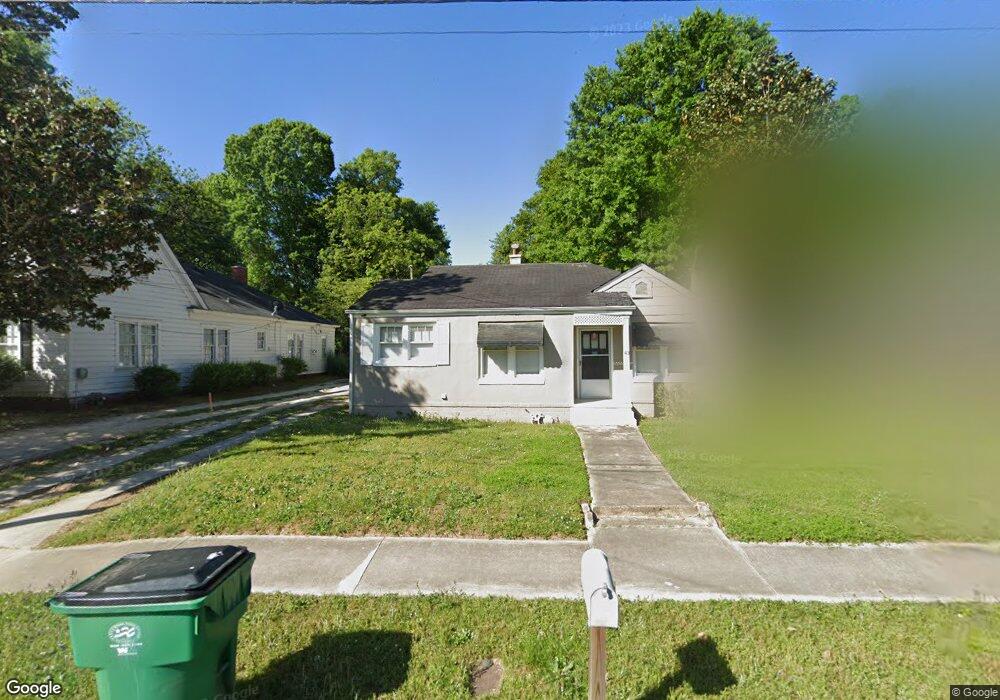
45 E Wright St Winder, GA 30680
Estimated Value: $194,000 - $231,000
2
Beds
1
Bath
816
Sq Ft
$262/Sq Ft
Est. Value
About This Home
This home is located at 45 E Wright St, Winder, GA 30680 and is currently estimated at $213,962, approximately $262 per square foot. 45 E Wright St is a home located in Barrow County with nearby schools including Holsenbeck Elementary School, Bear Creek Middle School, and Winder-Barrow High School.
Ownership History
Date
Name
Owned For
Owner Type
Purchase Details
Closed on
Jul 19, 2022
Sold by
Robinson Debra L
Bought by
Gem Holdings Llc
Current Estimated Value
Purchase Details
Closed on
Mar 10, 2003
Sold by
Townsend James W and Townsend Brenda M
Bought by
Robinson Debra L
Home Financials for this Owner
Home Financials are based on the most recent Mortgage that was taken out on this home.
Original Mortgage
$90,000
Interest Rate
5.88%
Mortgage Type
New Conventional
Purchase Details
Closed on
Feb 6, 2003
Sold by
Hayes J Keith
Bought by
Townsend James W and Townsend Brenda M
Home Financials for this Owner
Home Financials are based on the most recent Mortgage that was taken out on this home.
Original Mortgage
$90,000
Interest Rate
5.88%
Mortgage Type
New Conventional
Purchase Details
Closed on
Aug 5, 1991
Bought by
Hayes J Keith
Create a Home Valuation Report for This Property
The Home Valuation Report is an in-depth analysis detailing your home's value as well as a comparison with similar homes in the area
Home Values in the Area
Average Home Value in this Area
Purchase History
| Date | Buyer | Sale Price | Title Company |
|---|---|---|---|
| Gem Holdings Llc | $150,000 | -- | |
| Robinson Debra L | $80,000 | -- | |
| Townsend James W | $65,000 | -- | |
| Hayes J Keith | $25,000 | -- |
Source: Public Records
Mortgage History
| Date | Status | Borrower | Loan Amount |
|---|---|---|---|
| Previous Owner | Robinson Debra L | $90,000 | |
| Previous Owner | Townsend James W | $70,858 |
Source: Public Records
Tax History
| Year | Tax Paid | Tax Assessment Tax Assessment Total Assessment is a certain percentage of the fair market value that is determined by local assessors to be the total taxable value of land and additions on the property. | Land | Improvement |
|---|---|---|---|---|
| 2025 | $2,027 | $72,286 | $10,000 | $62,286 |
| 2024 | $2,009 | $70,358 | $10,000 | $60,358 |
| 2023 | $2,002 | $70,358 | $10,000 | $60,358 |
| 2022 | $1,619 | $45,981 | $10,000 | $35,981 |
| 2021 | $1,613 | $43,009 | $10,000 | $33,009 |
| 2020 | $1,315 | $35,936 | $10,000 | $25,936 |
| 2019 | $1,188 | $31,578 | $8,000 | $23,578 |
| 2018 | $1,185 | $31,578 | $8,000 | $23,578 |
| 2017 | $821 | $27,508 | $8,000 | $19,508 |
| 2016 | $959 | $27,508 | $8,000 | $19,508 |
| 2015 | $960 | $27,508 | $8,000 | $19,508 |
| 2014 | -- | $24,996 | $5,488 | $19,508 |
| 2013 | -- | $24,471 | $5,488 | $18,983 |
Source: Public Records
Map
Nearby Homes
- 209 Georgia Ave
- 18 E New St
- 122 Capitol Ave
- 160 N Broad St
- 10 W Wright St
- 5 W Kimball St
- 3 W Kimball St
- 1 W Kimball St
- 17 W Wright St
- 88 E Stephens St
- 221 Martin Luther King jr Dr
- 0 Jerome St Unit 10359679
- 317 Georgia Ave
- 208 Shields St
- 227 Martin Luther King jr Dr
- 131 Pinehurst Dr
- 403 Corinth Church Rd
- 270 Griffith St
- 184 Capitol Ave
- 267 Nancy St
- 47 E Wright St
- 39 E Wright St
- 230 Georgia Ave
- 51 E Wright St
- 224 Georgia Ave
- 0 Georgia Ave Unit 7127072
- 0 Georgia Ave Unit 7075683
- 0 Georgia Ave Unit B 8824832
- 0 Georgia Ave Unit 8825778
- 35 E Wright St
- 46 E New St
- E E New St Unit A
- E E New St Unit B
- E E New St
- 40 E New St
- 46 E Wright St
- 0 N Rd Front Sims Rd Unit 13 ACRES 8895969
- W B W New St
- 0 Mable Park Dr Unit 4 9053519
- 0 Sims Rd Unit 9056008
Your Personal Tour Guide
Ask me questions while you tour the home.