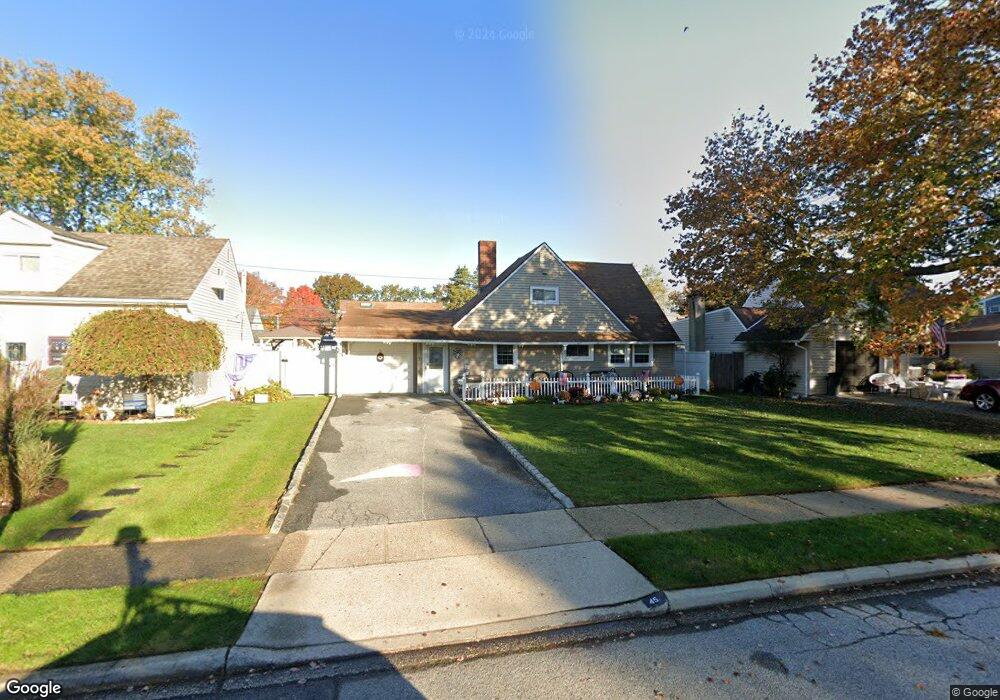
45 Elbow Ln Levittown, NY 11756
Estimated Value: $710,000 - $760,477
4
Beds
2
Baths
1,304
Sq Ft
$564/Sq Ft
Est. Value
About This Home
This home is located at 45 Elbow Ln, Levittown, NY 11756 and is currently estimated at $735,239, approximately $563 per square foot. 45 Elbow Ln is a home located in Nassau County with nearby schools including East Broadway School, Jonas E. Salk Middle School, and Gen. Douglas MacArthur Senior High School.
Ownership History
Date
Name
Owned For
Owner Type
Purchase Details
Closed on
Jan 18, 2011
Sold by
Guillerm Maryanne
Bought by
Yanez Lennin
Current Estimated Value
Home Financials for this Owner
Home Financials are based on the most recent Mortgage that was taken out on this home.
Original Mortgage
$263,992
Outstanding Balance
$180,325
Interest Rate
4.82%
Mortgage Type
Purchase Money Mortgage
Estimated Equity
$554,914
Purchase Details
Closed on
May 23, 2001
Sold by
Artesani Michael and Artesani Joanne
Bought by
Guillerm Maryanne
Create a Home Valuation Report for This Property
The Home Valuation Report is an in-depth analysis detailing your home's value as well as a comparison with similar homes in the area
Home Values in the Area
Average Home Value in this Area
Purchase History
| Date | Buyer | Sale Price | Title Company |
|---|---|---|---|
| Yanez Lennin | $329,990 | -- | |
| Guillerm Maryanne | $223,000 | Pat Goodsell |
Source: Public Records
Mortgage History
| Date | Status | Borrower | Loan Amount |
|---|---|---|---|
| Open | Yanez Lennin | $263,992 |
Source: Public Records
Tax History
| Year | Tax Paid | Tax Assessment Tax Assessment Total Assessment is a certain percentage of the fair market value that is determined by local assessors to be the total taxable value of land and additions on the property. | Land | Improvement |
|---|---|---|---|---|
| 2025 | $13,321 | $443 | $238 | $205 |
| 2024 | $3,630 | $443 | $238 | $205 |
Source: Public Records
Map
Nearby Homes
Your Personal Tour Guide
Ask me questions while you tour the home.