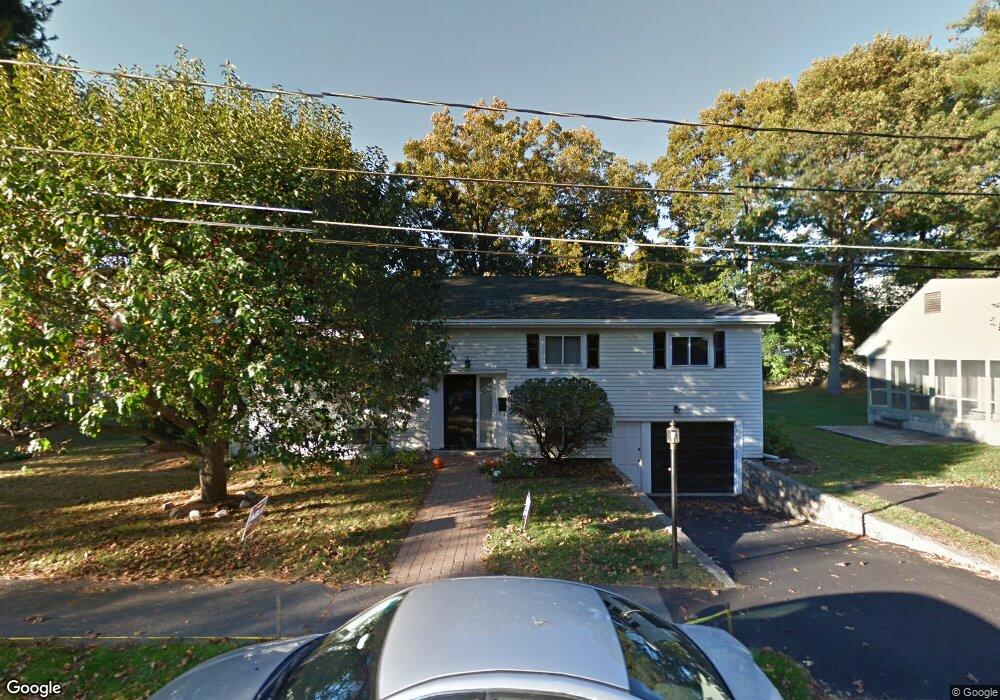
45 Enslin Rd Needham, MA 02492
Estimated Value: $1,160,000 - $1,299,555
3
Beds
3
Baths
1,350
Sq Ft
$926/Sq Ft
Est. Value
About This Home
This home is located at 45 Enslin Rd, Needham, MA 02492 and is currently estimated at $1,250,389, approximately $926 per square foot. 45 Enslin Rd is a home located in Norfolk County with nearby schools including Broadmeadow Elementary School, High Rock Middle School, and Pollard Middle School.
Ownership History
Date
Name
Owned For
Owner Type
Purchase Details
Closed on
Dec 27, 2012
Sold by
Pimentel Richard F and Pimentel Elaine
Bought by
Rep Irt and Pimentel
Current Estimated Value
Purchase Details
Closed on
Dec 14, 1990
Sold by
Lui Danny C
Bought by
Pimental Richard F
Home Financials for this Owner
Home Financials are based on the most recent Mortgage that was taken out on this home.
Original Mortgage
$167,200
Interest Rate
10.07%
Mortgage Type
Purchase Money Mortgage
Create a Home Valuation Report for This Property
The Home Valuation Report is an in-depth analysis detailing your home's value as well as a comparison with similar homes in the area
Home Values in the Area
Average Home Value in this Area
Purchase History
| Date | Buyer | Sale Price | Title Company |
|---|---|---|---|
| Rep Irt | -- | -- | |
| Rep Irt | -- | -- | |
| Pimental Richard F | $223,000 | -- | |
| Pimental Richard F | $223,000 | -- |
Source: Public Records
Mortgage History
| Date | Status | Borrower | Loan Amount |
|---|---|---|---|
| Previous Owner | Pimental Richard F | $100,000 | |
| Previous Owner | Pimental Richard F | $163,000 | |
| Previous Owner | Pimental Richard F | $167,200 |
Source: Public Records
Tax History
| Year | Tax Paid | Tax Assessment Tax Assessment Total Assessment is a certain percentage of the fair market value that is determined by local assessors to be the total taxable value of land and additions on the property. | Land | Improvement |
|---|---|---|---|---|
| 2025 | $11,436 | $1,078,900 | $791,600 | $287,300 |
| 2024 | $10,959 | $875,300 | $582,700 | $292,600 |
| 2023 | $11,089 | $850,400 | $582,700 | $267,700 |
| 2022 | $10,374 | $775,900 | $515,700 | $260,200 |
| 2021 | $10,110 | $775,900 | $515,700 | $260,200 |
| 2020 | $9,917 | $794,000 | $515,700 | $278,300 |
| 2019 | $9,222 | $744,300 | $468,800 | $275,500 |
| 2018 | $8,842 | $744,300 | $468,800 | $275,500 |
| 2017 | $8,435 | $709,400 | $468,800 | $240,600 |
| 2016 | $8,186 | $709,400 | $468,800 | $240,600 |
| 2015 | $8,009 | $709,400 | $468,800 | $240,600 |
| 2014 | $7,281 | $625,500 | $390,700 | $234,800 |
Source: Public Records
Map
Nearby Homes
- 883 Greendale Ave
- 60 Douglas Rd
- 28 Green St
- 31 Birds Hill Ave
- 50 Sterling Rd
- 176 Highgate St
- 242 Valley Rd
- 1204 Greendale Ave Unit 128
- 1202 Greendale Ave Unit 133
- 1202 Greendale Ave Unit 124
- 1206 Greendale Ave Unit 217
- 1206 Greendale Ave Unit 201
- 1212 Greendale Ave Unit 300
- 126 Prince St
- 68 Brookline St
- 37 Cottage Cir
- 37 Cottage Cir Unit 37
- 190 Brookline St
- 342 Needham St
- 36 Otis St Unit 36
Your Personal Tour Guide
Ask me questions while you tour the home.