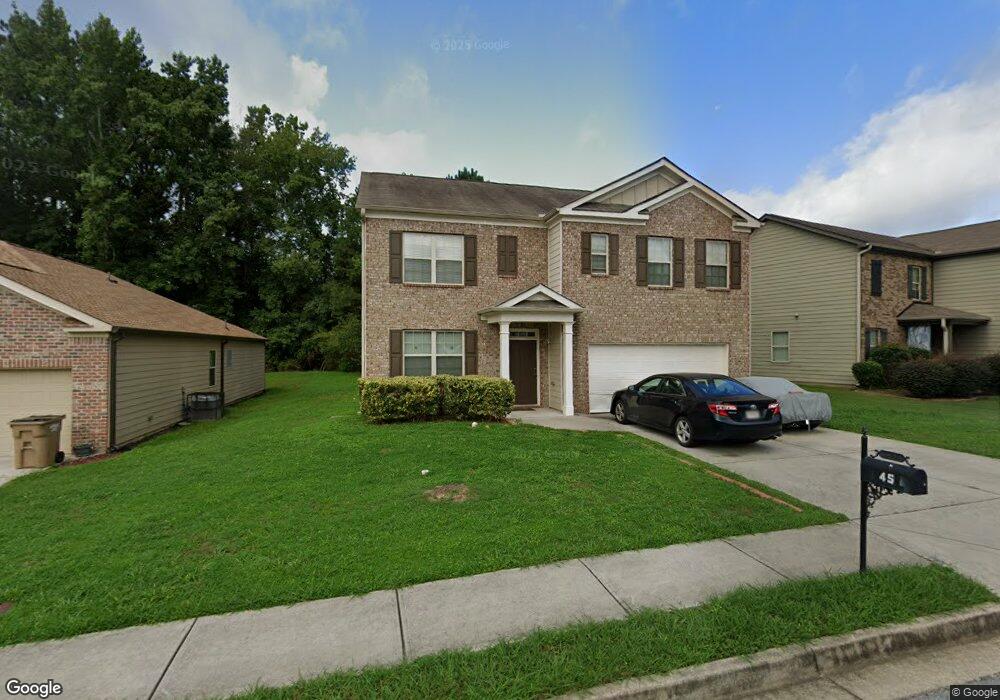
45 Euston Ct Unit LOT 239 Jonesboro, GA 30238
Estimated Value: $323,333 - $335,000
5
Beds
3
Baths
3,044
Sq Ft
$108/Sq Ft
Est. Value
About This Home
This home is located at 45 Euston Ct Unit LOT 239, Jonesboro, GA 30238 and is currently estimated at $327,333, approximately $107 per square foot. 45 Euston Ct Unit LOT 239 is a home located in Clayton County with nearby schools including Swint Elementary School, Pointe South Middle School, and Mundy's Mill High School.
Ownership History
Date
Name
Owned For
Owner Type
Purchase Details
Closed on
Oct 6, 2021
Sold by
Chen Liye
Bought by
Butler Oluwaseun
Current Estimated Value
Home Financials for this Owner
Home Financials are based on the most recent Mortgage that was taken out on this home.
Original Mortgage
$232,750
Outstanding Balance
$210,860
Interest Rate
2.8%
Mortgage Type
New Conventional
Estimated Equity
$116,473
Purchase Details
Closed on
Jul 13, 2021
Sold by
Wesby Jasmine
Bought by
Chen Liye and Zhou Dongxia
Purchase Details
Closed on
Feb 25, 2017
Sold by
Dr Horton Crown Llc
Bought by
Wesby Jasmine
Home Financials for this Owner
Home Financials are based on the most recent Mortgage that was taken out on this home.
Original Mortgage
$179,773
Interest Rate
4.19%
Mortgage Type
VA
Purchase Details
Closed on
Mar 24, 2016
Sold by
Pittsford Development Llc
Bought by
Dr Horton Inc
Create a Home Valuation Report for This Property
The Home Valuation Report is an in-depth analysis detailing your home's value as well as a comparison with similar homes in the area
Home Values in the Area
Average Home Value in this Area
Purchase History
| Date | Buyer | Sale Price | Title Company |
|---|---|---|---|
| Butler Oluwaseun | $258,000 | -- | |
| Chen Liye | $272,500 | -- | |
| Wesby Jasmine | $175,990 | -- | |
| Dr Horton Inc | $526,500 | -- |
Source: Public Records
Mortgage History
| Date | Status | Borrower | Loan Amount |
|---|---|---|---|
| Open | Butler Oluwaseun | $232,750 | |
| Previous Owner | Wesby Jasmine | $179,773 |
Source: Public Records
Tax History Compared to Growth
Tax History
| Year | Tax Paid | Tax Assessment Tax Assessment Total Assessment is a certain percentage of the fair market value that is determined by local assessors to be the total taxable value of land and additions on the property. | Land | Improvement |
|---|---|---|---|---|
| 2025 | $5,220 | $145,320 | $9,600 | $135,720 |
| 2024 | $5,142 | $140,840 | $9,600 | $131,240 |
| 2023 | $5,394 | $149,400 | $9,600 | $139,800 |
| 2022 | $4,088 | $103,200 | $9,000 | $94,200 |
| 2021 | $3,202 | $90,120 | $9,600 | $80,520 |
| 2020 | $3,240 | $90,055 | $9,600 | $80,455 |
| 2019 | $3,116 | $85,820 | $9,600 | $76,220 |
| 2018 | $2,490 | $70,396 | $9,600 | $60,796 |
| 2017 | $599 | $13,788 | $1,750 | $12,038 |
| 2016 | $429 | $9,600 | $9,600 | $0 |
| 2015 | $78 | $0 | $0 | $0 |
| 2014 | $78 | $1,000 | $1,000 | $0 |
Source: Public Records
Map
Nearby Homes
- 8448 Taylor Rd
- 101 Woburn St
- 8356 Dunellen Ln
- 37 Royce Dr Unit LOT 21
- 55 Royce Dr Unit 5
- 45 Royce Dr
- 8344 Dunellen Ln
- 8567 Regent St
- 46 Royce Dr
- 8511 Pineland Dr
- 8265 Attleboro Dr
- 8317 Mountain Pass
- 110 Flint River Rd
- 8207 Dunellen Ln
- 8303 Taylor Rd
- 1368 Riverstone Dr Unit 97
- 324 Cynthia Ct
- 213 Peartree Ln
- 8238 Canyon Forge Dr
- 255 Avalon Way
- 45 Euston Ct
- 51 Euston Ct Unit LOT 240
- 51 Euston Ct
- 39 Euston Ct
- 57 Euston Ct
- 33 Euston Ct
- 58 Euston Ct Unit LOT 112
- 58 Euston Ct
- 52 Euston Ct Unit LOT 111
- 52 Euston Ct Unit LOT 240
- 52 Euston Ct
- 64 Euston Ct Unit LOT 113
- 64 Euston Ct
- 63 Euston Ct Unit LOT 242
- 63 Euston Ct
- 46 Euston Ct
- 70 Euston Ct
- 40 Euston Ct
- 34 Euston Ct
- 76 Euston Ct Unit LOT 115