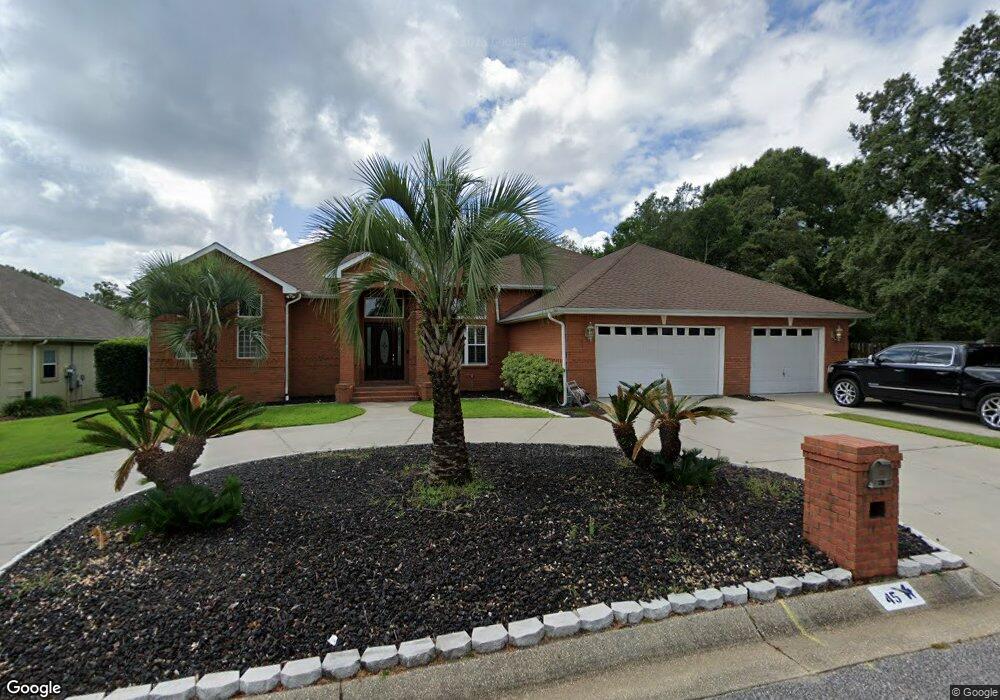
45 Faison St Pensacola, FL 32505
Estimated Value: $484,000 - $545,577
Studio
4
Baths
2,386
Sq Ft
$219/Sq Ft
Est. Value
About This Home
This home is located at 45 Faison St, Pensacola, FL 32505 and is currently estimated at $523,644, approximately $219 per square foot. 45 Faison St is a home located in Escambia County with nearby schools including Longleaf Elementary School, Bellview Middle School, and Pine Forest High School.
Ownership History
Date
Name
Owned For
Owner Type
Purchase Details
Closed on
Mar 24, 2025
Sold by
Penton Rusty Brooks and Penton Melissa Anne
Bought by
Penton Family Trust and Penton
Current Estimated Value
Purchase Details
Closed on
May 5, 2021
Sold by
Bennett Wendolyn R and Bennett Roderick
Bought by
Penton Rusty Brooks and Penton Melissa Anne
Home Financials for this Owner
Home Financials are based on the most recent Mortgage that was taken out on this home.
Original Mortgage
$383,800
Interest Rate
3.1%
Mortgage Type
New Conventional
Purchase Details
Closed on
May 16, 2011
Sold by
Rizzuti Robert John
Bought by
Bennett Wendolyn R
Home Financials for this Owner
Home Financials are based on the most recent Mortgage that was taken out on this home.
Original Mortgage
$200,000
Interest Rate
4.83%
Mortgage Type
Purchase Money Mortgage
Create a Home Valuation Report for This Property
The Home Valuation Report is an in-depth analysis detailing your home's value as well as a comparison with similar homes in the area
Home Values in the Area
Average Home Value in this Area
Purchase History
| Date | Buyer | Sale Price | Title Company |
|---|---|---|---|
| Penton Family Trust | $100 | None Listed On Document | |
| Penton Rusty Brooks | $404,000 | Attorneys Title Services Llc | |
| Bennett Wendolyn R | $200,000 | Old Town Title Of Pensacola |
Source: Public Records
Mortgage History
| Date | Status | Borrower | Loan Amount |
|---|---|---|---|
| Previous Owner | Penton Rusty Brooks | $383,800 | |
| Previous Owner | Bennett Wendolyn R | $200,000 |
Source: Public Records
Tax History
| Year | Tax Paid | Tax Assessment Tax Assessment Total Assessment is a certain percentage of the fair market value that is determined by local assessors to be the total taxable value of land and additions on the property. | Land | Improvement |
|---|---|---|---|---|
| 2025 | $5,487 | $391,289 | $64,000 | $327,289 |
| 2024 | $5,887 | $455,178 | $64,000 | $391,178 |
| 2023 | $5,887 | $474,697 | $64,000 | $410,697 |
| 2022 | $5,762 | $420,737 | $52,000 | $368,737 |
| 2021 | $3,545 | $286,780 | $0 | $0 |
| 2020 | $3,444 | $282,821 | $0 | $0 |
| 2019 | $4,192 | $296,043 | $0 | $0 |
| 2018 | $4,173 | $288,736 | $0 | $0 |
| 2017 | $4,106 | $277,850 | $0 | $0 |
| 2016 | $4,126 | $274,491 | $0 | $0 |
| 2015 | $3,849 | $253,087 | $0 | $0 |
| 2014 | $4,048 | $263,846 | $0 | $0 |
Source: Public Records
Map
Nearby Homes
- 2017 Hesperia Way
- 3175 Marcus Pointe Blvd
- 6649 Black Oak Place
- 3049 Liana Ln
- 6550 Bellview Pines Rd
- 2301 Windstone Dr
- 2319 Windstone Dr
- 3031 Oak Pointe Dr
- 3445 Marcus Pointe Blvd
- 2634 Tinosa Cir
- 5029 High Pointe Dr
- 6250 Forest Pines Dr
- 6278 Forest Pines Dr
- 6286 Forest Pines Dr
- 2907 Bellview Pointe Cir
- 6267 Forest Pines Dr
- 6271 Forest Pines Dr
- 6116 Bellview Pointe Ln
- 2601 Tinosa Cir
- 5065 Pine Hollow Dr
- 0 Faison St
- 41 Faison St
- 3305 Marcus Pointe Blvd
- 46 Faison St
- 42 Faison St
- 37 Faison St
- 3309 Marcus Pointe Blvd
- 38 Faison St
- 33 Faison St
- 6620 Greenwell St
- 34 Faison St
- 6624 Greenwell St
- 27 Bartlett Cir
- 3313 Marcus Pointe Blvd
- 29 Bartlett Cir
- 6616 Greenwell St
- 6628 Greenwell St
- 3317 Marcus Pointe Blvd
- 6612 Greenwell St
- 23 Bartlett Cir
Your Personal Tour Guide
Ask me questions while you tour the home.