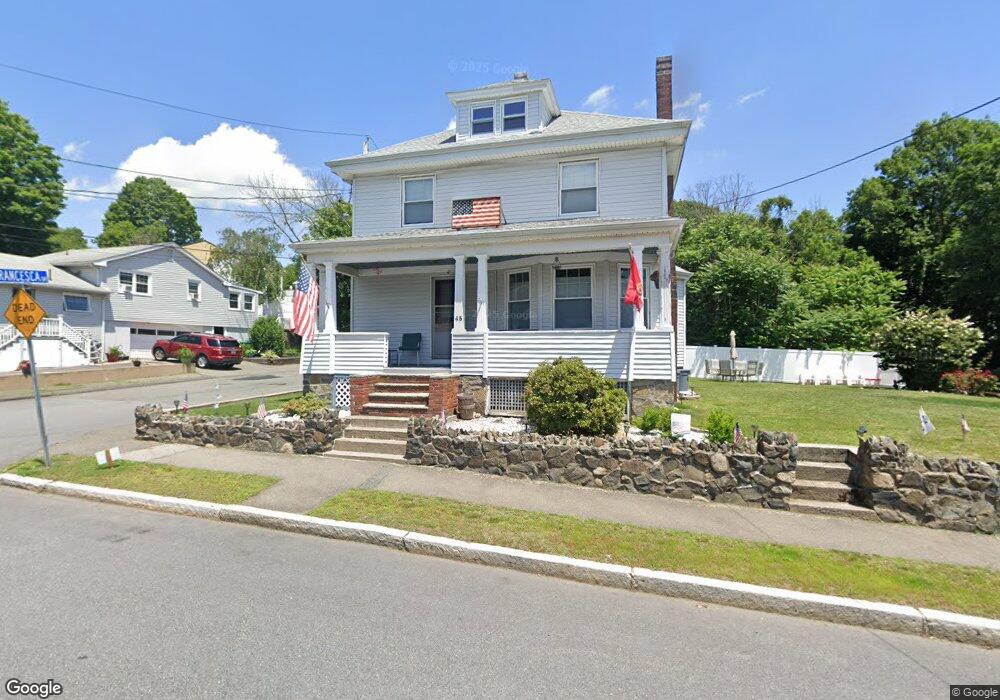
45 Fays Ave Lynn, MA 01904
Fays Estate NeighborhoodEstimated Value: $613,000 - $645,969
3
Beds
1
Bath
1,536
Sq Ft
$412/Sq Ft
Est. Value
About This Home
This home is located at 45 Fays Ave, Lynn, MA 01904 and is currently estimated at $632,492, approximately $411 per square foot. 45 Fays Ave is a home located in Essex County with nearby schools including Aborn Elementary School, William R. Fallon School, and Pickering Middle School.
Ownership History
Date
Name
Owned For
Owner Type
Purchase Details
Closed on
Dec 8, 2023
Sold by
Powers Mary A and Powers Timothy C
Bought by
45 Fays Avenue Rt and Powers
Current Estimated Value
Purchase Details
Closed on
Aug 28, 1998
Sold by
Legere Paul E and Legere Jo Anne
Bought by
Powers Timothy C and Powers Mary A
Create a Home Valuation Report for This Property
The Home Valuation Report is an in-depth analysis detailing your home's value as well as a comparison with similar homes in the area
Home Values in the Area
Average Home Value in this Area
Purchase History
| Date | Buyer | Sale Price | Title Company |
|---|---|---|---|
| 45 Fays Avenue Rt | -- | None Available | |
| 45 Fays Avenue Rt | -- | None Available | |
| Powers Timothy C | $130,000 | -- | |
| Powers Timothy C | $130,000 | -- |
Source: Public Records
Mortgage History
| Date | Status | Borrower | Loan Amount |
|---|---|---|---|
| Previous Owner | Powers Timothy C | $160,000 | |
| Previous Owner | Powers Timothy C | $40,000 | |
| Previous Owner | Powers Timothy C | $141,000 |
Source: Public Records
Tax History Compared to Growth
Tax History
| Year | Tax Paid | Tax Assessment Tax Assessment Total Assessment is a certain percentage of the fair market value that is determined by local assessors to be the total taxable value of land and additions on the property. | Land | Improvement |
|---|---|---|---|---|
| 2025 | $6,274 | $605,600 | $205,300 | $400,300 |
| 2024 | $5,919 | $562,100 | $196,800 | $365,300 |
| 2023 | $5,392 | $483,600 | $187,000 | $296,600 |
| 2022 | $5,396 | $434,100 | $155,400 | $278,700 |
| 2021 | $5,097 | $391,200 | $141,100 | $250,100 |
| 2020 | $5,113 | $381,600 | $144,300 | $237,300 |
| 2019 | $4,889 | $341,900 | $137,600 | $204,300 |
| 2018 | $4,766 | $314,600 | $134,500 | $180,100 |
| 2017 | $4,742 | $304,000 | $119,800 | $184,200 |
| 2016 | $4,407 | $272,400 | $103,300 | $169,100 |
| 2015 | $4,196 | $250,500 | $102,000 | $148,500 |
Source: Public Records
Map
Nearby Homes