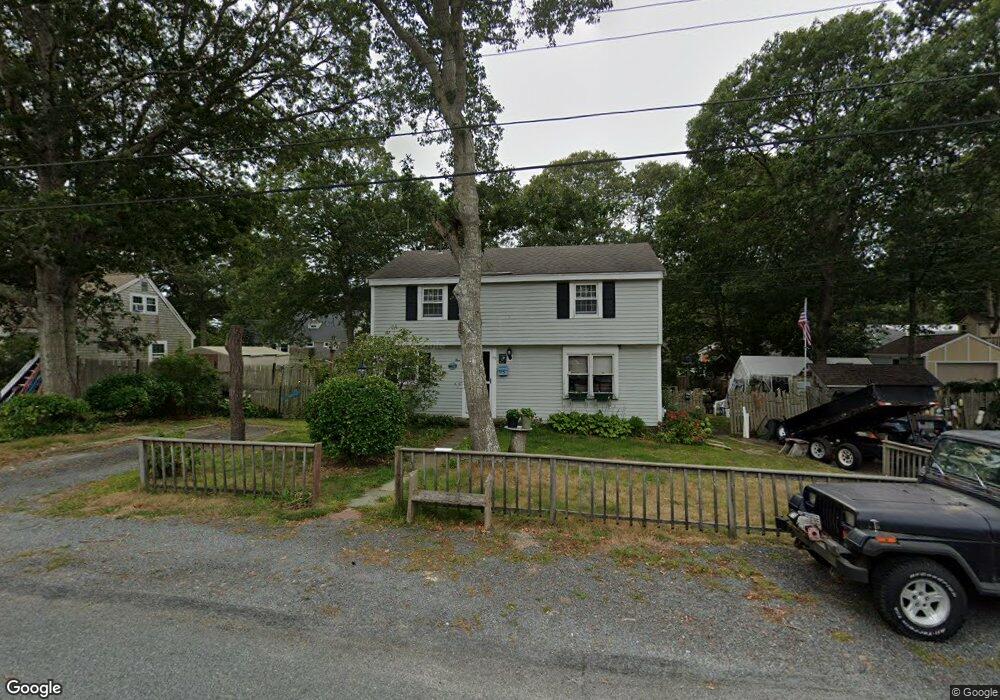
45 Finch Ln West Yarmouth, MA 02673
South Yarmouth NeighborhoodEstimated Value: $536,206 - $592,000
4
Beds
3
Baths
1,530
Sq Ft
$371/Sq Ft
Est. Value
About This Home
This home is located at 45 Finch Ln, West Yarmouth, MA 02673 and is currently estimated at $567,052, approximately $370 per square foot. 45 Finch Ln is a home located in Barnstable County with nearby schools including Dennis-Yarmouth Regional High School, Sturgis Charter Public School, and St. Pius X. School.
Ownership History
Date
Name
Owned For
Owner Type
Purchase Details
Closed on
Nov 19, 2009
Sold by
Nicolo Denise J and Carter Mary A
Bought by
Carter Melissa
Current Estimated Value
Home Financials for this Owner
Home Financials are based on the most recent Mortgage that was taken out on this home.
Original Mortgage
$180,000
Outstanding Balance
$116,689
Interest Rate
4.86%
Mortgage Type
Purchase Money Mortgage
Estimated Equity
$450,363
Create a Home Valuation Report for This Property
The Home Valuation Report is an in-depth analysis detailing your home's value as well as a comparison with similar homes in the area
Home Values in the Area
Average Home Value in this Area
Purchase History
| Date | Buyer | Sale Price | Title Company |
|---|---|---|---|
| Carter Melissa | $225,000 | -- |
Source: Public Records
Mortgage History
| Date | Status | Borrower | Loan Amount |
|---|---|---|---|
| Open | Carter Melissa | $180,000 |
Source: Public Records
Tax History Compared to Growth
Tax History
| Year | Tax Paid | Tax Assessment Tax Assessment Total Assessment is a certain percentage of the fair market value that is determined by local assessors to be the total taxable value of land and additions on the property. | Land | Improvement |
|---|---|---|---|---|
| 2025 | $3,115 | $440,000 | $145,600 | $294,400 |
| 2024 | $2,933 | $397,400 | $133,700 | $263,700 |
| 2023 | $3,032 | $373,800 | $124,100 | $249,700 |
| 2022 | $2,861 | $311,700 | $116,300 | $195,400 |
| 2021 | $2,630 | $275,100 | $116,300 | $158,800 |
| 2020 | $2,643 | $264,300 | $116,300 | $148,000 |
| 2019 | $2,751 | $252,100 | $116,300 | $135,800 |
| 2018 | $2,417 | $234,900 | $99,100 | $135,800 |
| 2017 | $2,343 | $230,600 | $94,800 | $135,800 |
| 2016 | $2,216 | $222,000 | $86,200 | $135,800 |
| 2015 | $2,243 | $223,400 | $86,200 | $137,200 |
Source: Public Records
Map
Nearby Homes
- 68 Bob-O-link Ln
- 11 Bob-O-link Ln
- 33 Lake Rd
- 20 Robin Rd
- 24 Fast Brook Rd
- 274 Winslow Gray Rd
- 3 Saturn Ln
- 23 Circuit Rd N
- 255 Long Pond Dr
- 844 Route 28 Unit 2A
- 844 Route 28 Unit 9B
- 844 Route 28 Unit 2A
- 17 South St
- 18 Captain Stanley Rd
- 48 Captain Dore Rd
- 27 Angus Ave
- 17 Angus Ave
- 8 Rogers Ave
- 35 Captain Percival Rd
- 26 Howes Rd
- 49 Finch Ln
- 39 Finch Ln
- 46 Bob o Link Ln
- 46 Bob-O-link Ln
- 50 Bob o Link Ln
- 28 Merganser Ln
- 50 Bob-O-link Ln
- 27 Black Duck Ln
- 40 Bob o Link Ln
- 35 Finch Ln
- 155 Swan Lake Rd
- 27 Merganser Ln
- 36 Bob o Link Ln
- 45 Bob-O-link Ln
- 45 Bob o Link Ln
- 22 Merganser Ln
- 26 Bob-O-link Ln
- 39 Bob o Link Ln
- 49 Bob o Link Ln
- 21 Black Duck Ln