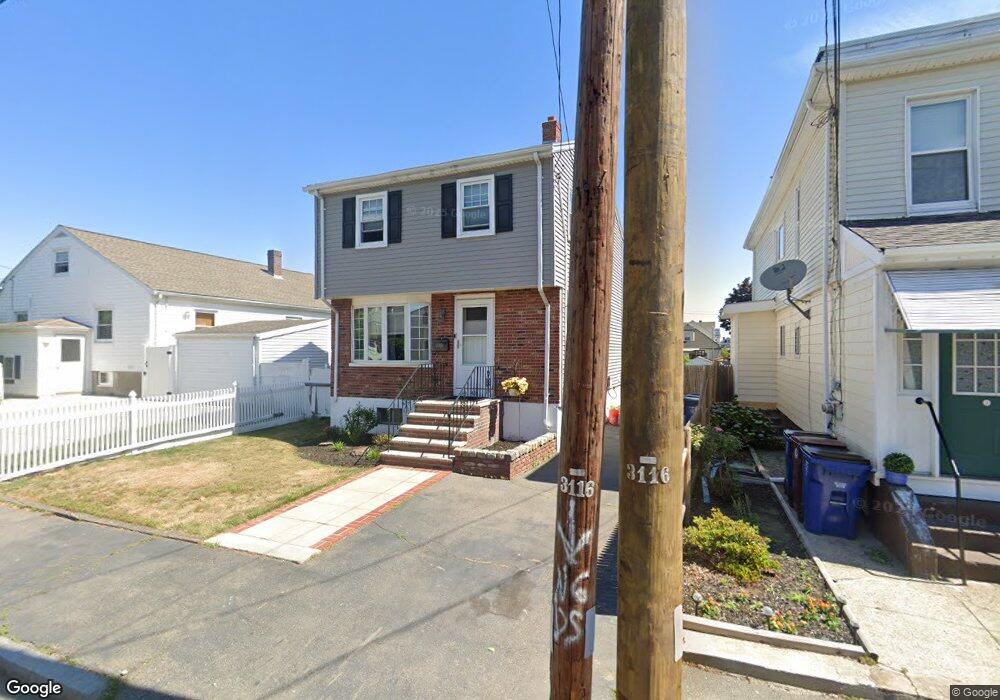
45 Fiske St Revere, MA 02151
West Revere NeighborhoodEstimated Value: $607,000 - $691,000
3
Beds
2
Baths
1,040
Sq Ft
$631/Sq Ft
Est. Value
About This Home
This home is located at 45 Fiske St, Revere, MA 02151 and is currently estimated at $656,407, approximately $631 per square foot. 45 Fiske St is a home located in Suffolk County with nearby schools including Abraham Lincoln School, Staff Sargent James J. Hill Elementary School, and Rumney Marsh Academy.
Ownership History
Date
Name
Owned For
Owner Type
Purchase Details
Closed on
May 20, 1998
Sold by
Demarco John A and Demarco Lori A
Bought by
White Kristen and Harkins Edward
Current Estimated Value
Create a Home Valuation Report for This Property
The Home Valuation Report is an in-depth analysis detailing your home's value as well as a comparison with similar homes in the area
Home Values in the Area
Average Home Value in this Area
Purchase History
| Date | Buyer | Sale Price | Title Company |
|---|---|---|---|
| White Kristen | $150,000 | -- | |
| White Kristen | $150,000 | -- |
Source: Public Records
Mortgage History
| Date | Status | Borrower | Loan Amount |
|---|---|---|---|
| Open | White Kristen | $250,000 | |
| Closed | White Kristen | $240,000 |
Source: Public Records
Tax History Compared to Growth
Tax History
| Year | Tax Paid | Tax Assessment Tax Assessment Total Assessment is a certain percentage of the fair market value that is determined by local assessors to be the total taxable value of land and additions on the property. | Land | Improvement |
|---|---|---|---|---|
| 2025 | $4,980 | $549,100 | $284,500 | $264,600 |
| 2024 | $4,815 | $528,500 | $268,700 | $259,800 |
| 2023 | $4,545 | $477,900 | $224,500 | $253,400 |
| 2022 | $4,607 | $443,000 | $213,400 | $229,600 |
| 2021 | $4,355 | $393,800 | $197,600 | $196,200 |
| 2020 | $4,434 | $393,800 | $197,600 | $196,200 |
| 2019 | $4,293 | $354,500 | $180,200 | $174,300 |
| 2018 | $4,191 | $323,400 | $162,800 | $160,600 |
| 2017 | $4,103 | $293,300 | $142,300 | $151,000 |
| 2016 | $3,701 | $256,100 | $129,600 | $126,500 |
| 2015 | $3,790 | $256,100 | $129,600 | $126,500 |
Source: Public Records
Map
Nearby Homes