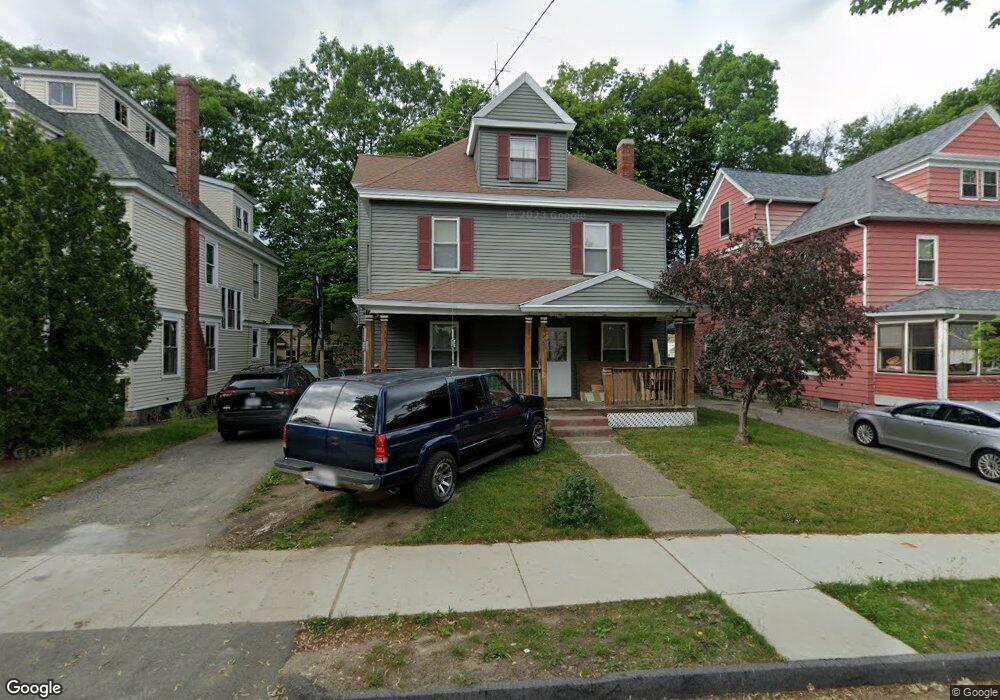
45 Forbes St Worcester, MA 01605
Brittan Square NeighborhoodEstimated Value: $465,000 - $540,000
4
Beds
2
Baths
3,455
Sq Ft
$149/Sq Ft
Est. Value
About This Home
This home is located at 45 Forbes St, Worcester, MA 01605 and is currently estimated at $513,519, approximately $148 per square foot. 45 Forbes St is a home located in Worcester County with nearby schools including Jacob Hiatt Magnet School, Chandler Magnet, and Burncoat Middle School.
Ownership History
Date
Name
Owned For
Owner Type
Purchase Details
Closed on
Aug 31, 1998
Sold by
Esparza Vincente R and Esparza Nancy K
Bought by
Lopez Luis A and Lopez Celia
Current Estimated Value
Home Financials for this Owner
Home Financials are based on the most recent Mortgage that was taken out on this home.
Original Mortgage
$86,450
Outstanding Balance
$18,467
Interest Rate
6.9%
Mortgage Type
Purchase Money Mortgage
Estimated Equity
$495,052
Purchase Details
Closed on
Jun 9, 1992
Sold by
Belsito Paul V and Belsito Elizabeth
Bought by
Esparza Vicente R and Esparza Nancy K
Home Financials for this Owner
Home Financials are based on the most recent Mortgage that was taken out on this home.
Original Mortgage
$69,300
Interest Rate
8.8%
Mortgage Type
Purchase Money Mortgage
Create a Home Valuation Report for This Property
The Home Valuation Report is an in-depth analysis detailing your home's value as well as a comparison with similar homes in the area
Home Values in the Area
Average Home Value in this Area
Purchase History
| Date | Buyer | Sale Price | Title Company |
|---|---|---|---|
| Lopez Luis A | $89,000 | -- | |
| Esparza Vicente R | $73,000 | -- |
Source: Public Records
Mortgage History
| Date | Status | Borrower | Loan Amount |
|---|---|---|---|
| Open | Esparza Vicente R | $86,450 | |
| Previous Owner | Esparza Vicente R | $10,000 | |
| Previous Owner | Esparza Vicente R | $70,700 | |
| Previous Owner | Esparza Vicente R | $69,300 |
Source: Public Records
Tax History Compared to Growth
Tax History
| Year | Tax Paid | Tax Assessment Tax Assessment Total Assessment is a certain percentage of the fair market value that is determined by local assessors to be the total taxable value of land and additions on the property. | Land | Improvement |
|---|---|---|---|---|
| 2025 | $6,215 | $471,200 | $78,600 | $392,600 |
| 2024 | $6,021 | $437,900 | $78,600 | $359,300 |
| 2023 | $5,834 | $406,800 | $68,400 | $338,400 |
| 2022 | $5,441 | $357,700 | $54,700 | $303,000 |
| 2021 | $5,480 | $336,600 | $43,800 | $292,800 |
| 2020 | $5,245 | $308,500 | $43,500 | $265,000 |
| 2019 | $5,029 | $279,400 | $38,000 | $241,400 |
| 2018 | $4,951 | $261,800 | $38,000 | $223,800 |
| 2017 | $4,938 | $256,900 | $38,000 | $218,900 |
| 2016 | $5,066 | $245,800 | $27,500 | $218,300 |
| 2015 | $4,482 | $223,300 | $27,500 | $195,800 |
| 2014 | $4,363 | $223,300 | $27,500 | $195,800 |
Source: Public Records
Map
Nearby Homes
- 55 Channing St
- 26 Orne St
- 44 Westminster St
- 82 Green Hill Pkwy
- 78 Green Hill Pkwy
- 41 Westminster St
- 74 Green Hill Pkwy
- 139 Lincoln St
- 12 Windsor St
- 10 Windsor St Unit C
- 40 Hooper St
- 126 Lincoln St
- 73 Paine St
- 19 Mckinley Rd
- 24 Catharine St
- 119 Rodney St
- 23 Ashton St
- 67 Everard St
- 33 Denmark St
- 17 Vinson St
- 49 Forbes St
- 41 Forbes St
- 34 Windsor St
- 51 Forbes St
- 38 Orne St
- 32 Windsor St
- 34 Orne St
- 48 Forbes St
- 48 Forbes St Unit 3
- 40 Orne St Unit 2
- 40 Orne St Unit 1
- 57 Channing St
- 37 Forbes St
- 37 Forbes St Unit 2
- 61 Channing St Unit 3
- 61 Channing St Unit 2
- 61 Channing St Unit 1
- 61 Channing St
- 30 Windsor St
- 30 Orne St