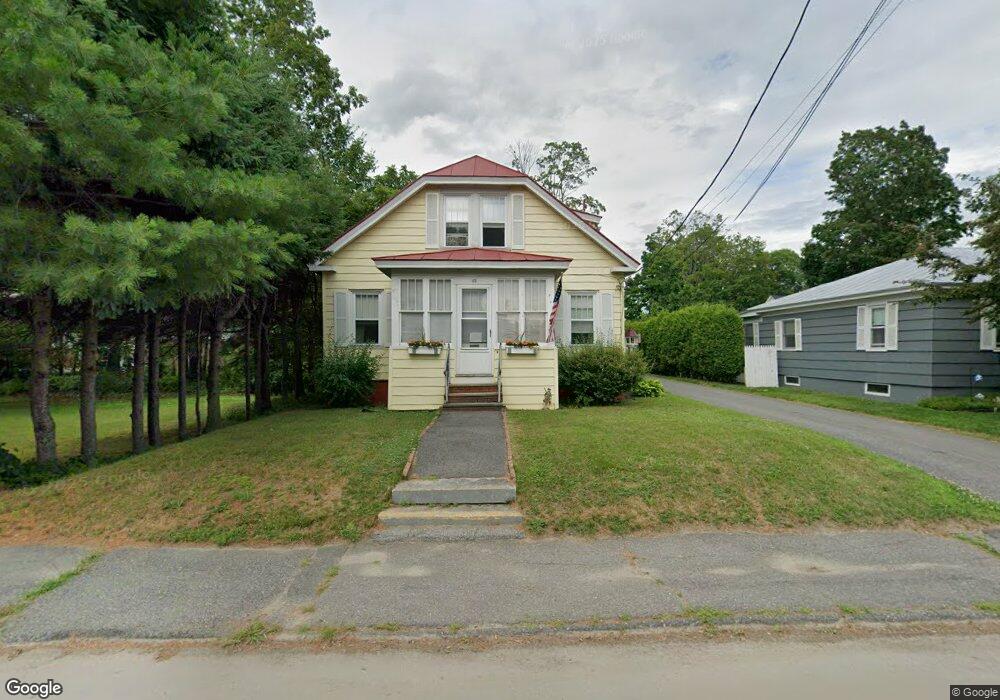
45 Gold St Waterville, ME 04901
Estimated Value: $192,000 - $240,000
3
Beds
2
Baths
1,872
Sq Ft
$116/Sq Ft
Est. Value
About This Home
This home is located at 45 Gold St, Waterville, ME 04901 and is currently estimated at $216,919, approximately $115 per square foot. 45 Gold St is a home located in Kennebec County with nearby schools including George J. Mitchell School, Albert S. Hall School, and Waterville Junior High School.
Ownership History
Date
Name
Owned For
Owner Type
Purchase Details
Closed on
Jul 11, 2024
Sold by
Couture Edward E Est and Jordan
Bought by
Hallee Claude A and Hallee Sylvia L
Current Estimated Value
Home Financials for this Owner
Home Financials are based on the most recent Mortgage that was taken out on this home.
Original Mortgage
$140,000
Outstanding Balance
$138,092
Interest Rate
7.03%
Mortgage Type
Purchase Money Mortgage
Estimated Equity
$78,827
Purchase Details
Closed on
Aug 24, 2015
Sold by
Enriched Asset Group Llc
Bought by
Couture Edward and Couture Cecile
Purchase Details
Closed on
Mar 11, 2013
Sold by
Poulin Cleo M Est and Poulin
Bought by
Enriched Asset Group Llc
Create a Home Valuation Report for This Property
The Home Valuation Report is an in-depth analysis detailing your home's value as well as a comparison with similar homes in the area
Home Values in the Area
Average Home Value in this Area
Purchase History
| Date | Buyer | Sale Price | Title Company |
|---|---|---|---|
| Hallee Claude A | $175,000 | None Available | |
| Hallee Claude A | $175,000 | None Available | |
| Couture Edward | -- | -- | |
| Couture Edward | -- | -- | |
| Enriched Asset Group Llc | -- | -- | |
| Enriched Asset Group Llc | -- | -- |
Source: Public Records
Mortgage History
| Date | Status | Borrower | Loan Amount |
|---|---|---|---|
| Open | Hallee Claude A | $140,000 | |
| Closed | Hallee Claude A | $140,000 |
Source: Public Records
Tax History Compared to Growth
Tax History
| Year | Tax Paid | Tax Assessment Tax Assessment Total Assessment is a certain percentage of the fair market value that is determined by local assessors to be the total taxable value of land and additions on the property. | Land | Improvement |
|---|---|---|---|---|
| 2025 | $3,347 | $196,900 | $25,400 | $171,500 |
| 2024 | $3,182 | $159,100 | $19,500 | $139,600 |
| 2023 | $3,166 | $159,100 | $19,500 | $139,600 |
| 2022 | $2,223 | $86,000 | $14,700 | $71,300 |
| 2021 | $2,193 | $86,000 | $14,700 | $71,300 |
| 2020 | $2,215 | $86,000 | $14,700 | $71,300 |
| 2019 | $2,215 | $86,000 | $14,700 | $71,300 |
| 2018 | $2,173 | $86,000 | $14,700 | $71,300 |
| 2017 | $2,006 | $86,000 | $14,700 | $71,300 |
| 2016 | $1,961 | $86,000 | $14,700 | $71,300 |
| 2015 | $1,990 | $71,600 | $16,900 | $54,700 |
| 2014 | -- | $71,600 | $16,900 | $54,700 |
| 2013 | $1,962 | $71,600 | $16,900 | $54,700 |
Source: Public Records
Map
Nearby Homes