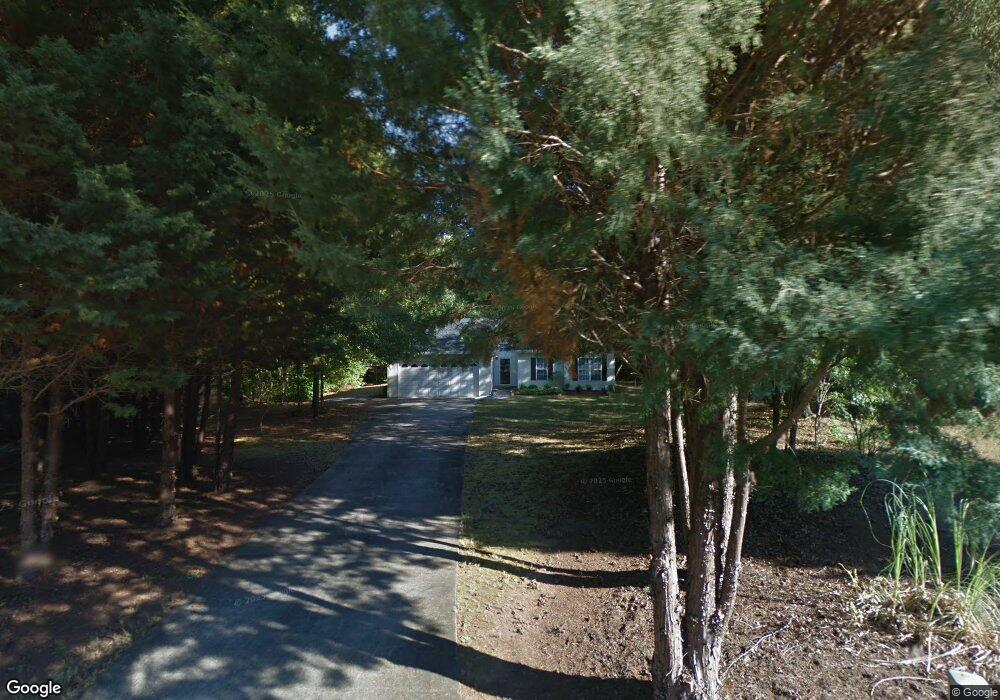
45 Golden Ct Sharpsburg, GA 30277
Estimated Value: $272,856 - $312,000
3
Beds
2
Baths
1,236
Sq Ft
$241/Sq Ft
Est. Value
About This Home
This home is located at 45 Golden Ct, Sharpsburg, GA 30277 and is currently estimated at $297,964, approximately $241 per square foot. 45 Golden Ct is a home located in Coweta County with nearby schools including Poplar Road Elementary School, Lee Middle School, and East Coweta High School.
Ownership History
Date
Name
Owned For
Owner Type
Purchase Details
Closed on
Mar 17, 2020
Sold by
Larson Eugene S
Bought by
Weaver Mary
Current Estimated Value
Home Financials for this Owner
Home Financials are based on the most recent Mortgage that was taken out on this home.
Original Mortgage
$144,000
Outstanding Balance
$127,011
Interest Rate
3.4%
Mortgage Type
New Conventional
Estimated Equity
$170,953
Purchase Details
Closed on
Apr 8, 2005
Sold by
Larson Eugene S and Larson B
Bought by
Larson Eugene S
Purchase Details
Closed on
Jul 1, 1996
Sold by
Cosper Homes Sherri
Bought by
Larson Eugene Martha
Purchase Details
Closed on
Feb 21, 1996
Bought by
Rick Cosper Homes In
Purchase Details
Closed on
Nov 15, 1994
Bought by
R C Development Inc
Purchase Details
Closed on
May 31, 1985
Bought by
Hill William F
Create a Home Valuation Report for This Property
The Home Valuation Report is an in-depth analysis detailing your home's value as well as a comparison with similar homes in the area
Home Values in the Area
Average Home Value in this Area
Purchase History
| Date | Buyer | Sale Price | Title Company |
|---|---|---|---|
| Weaver Mary | $180,000 | -- | |
| Larson Eugene S | -- | -- | |
| Larson Eugene Martha | $94,900 | -- | |
| Rick Cosper Homes In | $19,900 | -- | |
| R C Development Inc | $390,000 | -- | |
| Hill William F | -- | -- |
Source: Public Records
Mortgage History
| Date | Status | Borrower | Loan Amount |
|---|---|---|---|
| Open | Weaver Mary | $144,000 | |
| Closed | Larson Eugene Martha | $0 |
Source: Public Records
Tax History Compared to Growth
Tax History
| Year | Tax Paid | Tax Assessment Tax Assessment Total Assessment is a certain percentage of the fair market value that is determined by local assessors to be the total taxable value of land and additions on the property. | Land | Improvement |
|---|---|---|---|---|
| 2025 | $2,384 | $105,990 | $24,000 | $81,990 |
| 2024 | $2,339 | $105,350 | $24,000 | $81,350 |
| 2023 | $2,339 | $91,070 | $20,000 | $71,070 |
| 2022 | $1,953 | $83,983 | $20,000 | $63,983 |
| 2021 | $1,459 | $60,080 | $16,000 | $44,080 |
| 2020 | $462 | $60,080 | $16,000 | $44,080 |
| 2019 | $463 | $53,034 | $10,000 | $43,034 |
| 2018 | $466 | $53,034 | $10,000 | $43,034 |
| 2017 | $466 | $53,034 | $10,000 | $43,034 |
| 2016 | $451 | $53,034 | $10,000 | $43,034 |
| 2015 | $374 | $47,570 | $10,000 | $37,570 |
| 2014 | $310 | $43,862 | $8,000 | $35,862 |
Source: Public Records
Map
Nearby Homes
- 180 Saint James Place
- 140 Halo Trace
- 25 Chemin Place
- 25 Lentry Dr
- 0 Highway 154 Unit 10470800
- 250 Bob Smith Rd
- 196 Bob Smith Rd
- 0 Bob Smith Rd Unit 10562838
- 138 Main St
- 21 Lake Park Ct
- 8 Chiefs Trail
- 1 Mcintosh Trail
- 20 Beaver Creek Ln
- 296 Mcintosh Trail
- 1367 Sharpsburg McCollum Rd
- 28 Fawn Ct
- 50 Kay Ct
- 270 Sturgess Run
- 68 Winchester Dr
- 40 Long Branch Trail