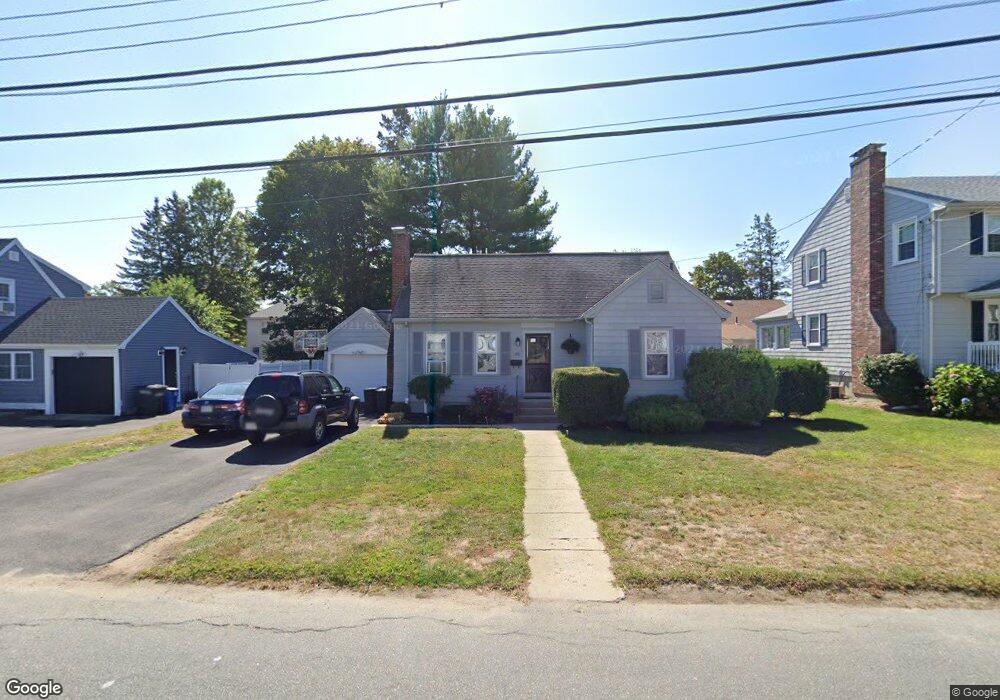
45 Gorham Ave Stoneham, MA 02180
Haywardville NeighborhoodEstimated Value: $773,681 - $850,000
4
Beds
2
Baths
2,025
Sq Ft
$399/Sq Ft
Est. Value
About This Home
This home is located at 45 Gorham Ave, Stoneham, MA 02180 and is currently estimated at $808,170, approximately $399 per square foot. 45 Gorham Ave is a home located in Middlesex County with nearby schools including Stoneham High School, Greater Boston Academy, and St. Patrick Elementary School.
Ownership History
Date
Name
Owned For
Owner Type
Purchase Details
Closed on
Mar 24, 2003
Sold by
Pizzano Laurieanne and Joyce David
Bought by
Pizzano Laurieanne and Joyce David
Current Estimated Value
Home Financials for this Owner
Home Financials are based on the most recent Mortgage that was taken out on this home.
Original Mortgage
$233,000
Outstanding Balance
$100,313
Interest Rate
5.9%
Estimated Equity
$707,857
Purchase Details
Closed on
Feb 2, 1999
Sold by
Colvario Joyce A
Bought by
Joyce David and Pizzano Laurieanne
Home Financials for this Owner
Home Financials are based on the most recent Mortgage that was taken out on this home.
Original Mortgage
$202,500
Interest Rate
6.67%
Mortgage Type
Purchase Money Mortgage
Create a Home Valuation Report for This Property
The Home Valuation Report is an in-depth analysis detailing your home's value as well as a comparison with similar homes in the area
Home Values in the Area
Average Home Value in this Area
Purchase History
| Date | Buyer | Sale Price | Title Company |
|---|---|---|---|
| Pizzano Laurieanne | -- | -- | |
| Joyce David | $232,500 | -- |
Source: Public Records
Mortgage History
| Date | Status | Borrower | Loan Amount |
|---|---|---|---|
| Open | Pizzano Laurieanne | $233,000 | |
| Previous Owner | Joyce David | $202,500 | |
| Previous Owner | Joyce David | $25,000 | |
| Previous Owner | Joyce David | $60,000 |
Source: Public Records
Tax History
| Year | Tax Paid | Tax Assessment Tax Assessment Total Assessment is a certain percentage of the fair market value that is determined by local assessors to be the total taxable value of land and additions on the property. | Land | Improvement |
|---|---|---|---|---|
| 2025 | $6,578 | $643,000 | $342,300 | $300,700 |
| 2024 | $6,284 | $593,400 | $315,300 | $278,100 |
| 2023 | $6,117 | $551,100 | $288,200 | $262,900 |
| 2022 | $5,312 | $510,300 | $261,200 | $249,100 |
| 2021 | $5,383 | $497,500 | $252,200 | $245,300 |
| 2020 | $7,255 | $478,800 | $237,800 | $241,000 |
| 2019 | $5,074 | $452,200 | $230,200 | $222,000 |
| 2018 | $4,919 | $420,100 | $202,600 | $217,500 |
| 2017 | $4,672 | $377,100 | $185,100 | $192,000 |
| 2016 | $4,620 | $363,800 | $185,100 | $178,700 |
| 2015 | $4,397 | $339,300 | $176,700 | $162,600 |
| 2014 | $4,390 | $325,400 | $168,200 | $157,200 |
Source: Public Records
Map
Nearby Homes
- 6 Everett St
- 137 Franklin St Unit 102
- 57 Park St
- 17 Franklin St
- 159 Franklin St Unit D2
- 159 Franklin St Unit C2
- 159 Franklin St Unit E6
- 35 Wright St
- 8 Common St Unit 3
- 53 Perkins St
- 33 Lake Ave
- 10 Pomeworth St Unit A
- 2 Mason Way Unit 6524
- 6 Mason Way Unit 6324
- 19 Mason Way Unit 75
- 51 Spring St
- 200 Ledgewood Dr Unit 601
- 132 Walton Park
- 6 Stratton Dr Unit 307
- 6 Stratton Dr Unit 208
Your Personal Tour Guide
Ask me questions while you tour the home.