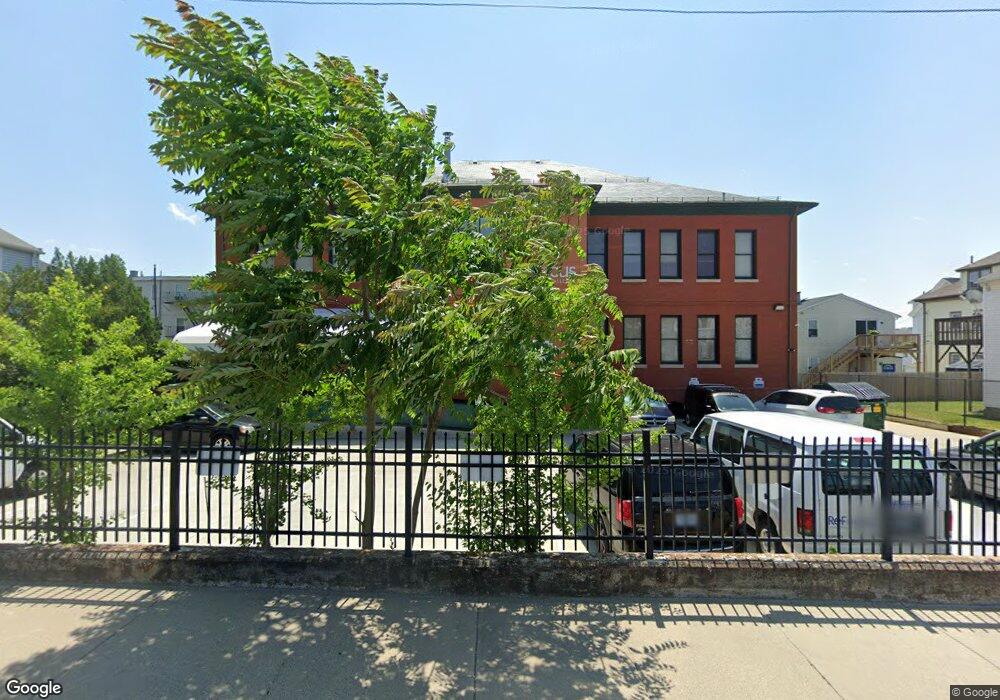
45 Greeley St Providence, RI 02904
Charles Neighborhood
Studio
--
Bath
13,722
Sq Ft
19,166
Sq Ft Lot
About This Home
This home is located at 45 Greeley St, Providence, RI 02904. 45 Greeley St is a home located in Providence County with nearby schools including Times Squared Academy, Times2 Elementary School, and Times2 Middle/High School.
Ownership History
Date
Name
Owned For
Owner Type
Purchase Details
Closed on
Jul 30, 2008
Sold by
Highlander Charter Sch
Bought by
Re Focis Inc
Home Financials for this Owner
Home Financials are based on the most recent Mortgage that was taken out on this home.
Original Mortgage
$1,136,000
Outstanding Balance
$744,456
Interest Rate
6.47%
Mortgage Type
Commercial
Purchase Details
Closed on
Aug 4, 2000
Sold by
Stanns Catholic Church
Bought by
Big Picture Co
Create a Home Valuation Report for This Property
The Home Valuation Report is an in-depth analysis detailing your home's value as well as a comparison with similar homes in the area
Home Values in the Area
Average Home Value in this Area
Purchase History
| Date | Buyer | Sale Price | Title Company |
|---|---|---|---|
| Re Focis Inc | $2,200,000 | -- | |
| Big Picture Co | $295,000 | -- |
Source: Public Records
Mortgage History
| Date | Status | Borrower | Loan Amount |
|---|---|---|---|
| Open | Big Picture Co | $125,000 | |
| Open | Big Picture Co | $1,136,000 | |
| Previous Owner | Big Picture Co | $1,600,000 | |
| Previous Owner | Big Picture Co | $100,000 |
Source: Public Records
Map
Nearby Homes
Your Personal Tour Guide
Ask me questions while you tour the home.