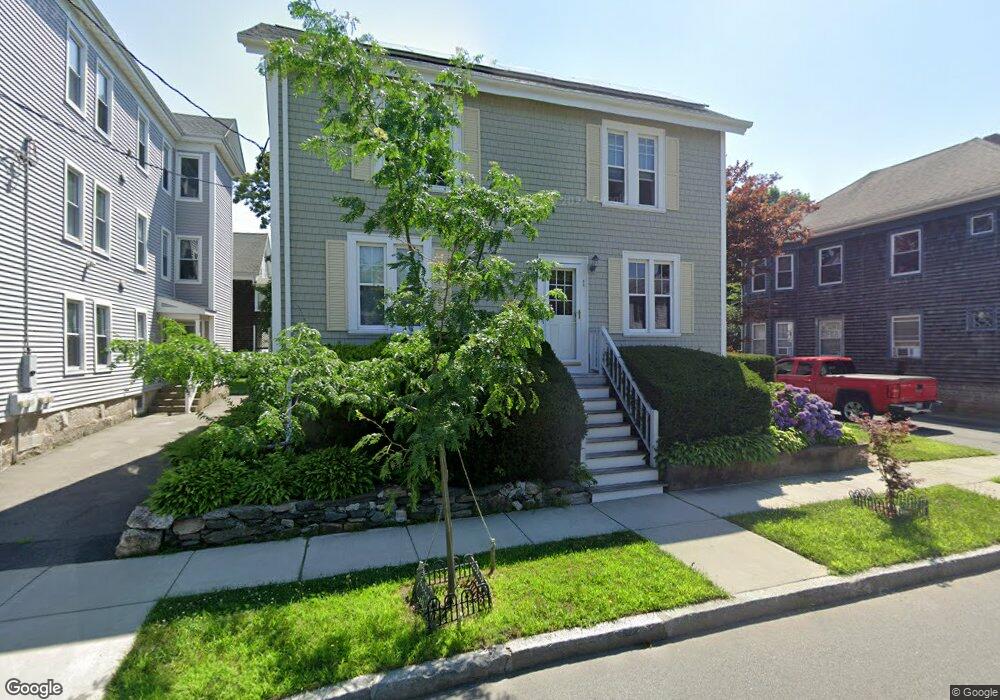
45 Green St Fairhaven, MA 02719
Estimated Value: $506,000 - $1,844,429
5
Beds
3
Baths
2,504
Sq Ft
$344/Sq Ft
Est. Value
About This Home
This home is located at 45 Green St, Fairhaven, MA 02719 and is currently estimated at $861,357, approximately $343 per square foot. 45 Green St is a home located in Bristol County with nearby schools including Fairhaven High School, City On A Hill Charter Public School New Bedford, and St. Joseph School.
Ownership History
Date
Name
Owned For
Owner Type
Purchase Details
Closed on
Oct 26, 2018
Sold by
Cruz William L
Bought by
Bramwell Bruce G and Bramwell Darleen
Current Estimated Value
Purchase Details
Closed on
Sep 20, 2012
Sold by
Sykes David K and Sykes Bethany H
Bought by
Sykes Ft
Purchase Details
Closed on
Nov 18, 1992
Sold by
New Bedford 5 Cents Sb
Bought by
Plaza Inc
Create a Home Valuation Report for This Property
The Home Valuation Report is an in-depth analysis detailing your home's value as well as a comparison with similar homes in the area
Home Values in the Area
Average Home Value in this Area
Purchase History
| Date | Buyer | Sale Price | Title Company |
|---|---|---|---|
| Bramwell Bruce G | -- | -- | |
| Sykes Ft | -- | -- | |
| Plaza Inc | $440,000 | -- |
Source: Public Records
Mortgage History
| Date | Status | Borrower | Loan Amount |
|---|---|---|---|
| Previous Owner | Plaza Inc | $180,000 | |
| Previous Owner | Plaza Inc | $170,000 | |
| Previous Owner | Plaza Inc | $150,000 | |
| Previous Owner | Plaza Inc | $110,000 |
Source: Public Records
Tax History
| Year | Tax Paid | Tax Assessment Tax Assessment Total Assessment is a certain percentage of the fair market value that is determined by local assessors to be the total taxable value of land and additions on the property. | Land | Improvement |
|---|---|---|---|---|
| 2025 | $50 | $535,900 | $242,200 | $293,700 |
| 2024 | $4,868 | $527,400 | $242,200 | $285,200 |
| 2023 | $4,678 | $470,200 | $209,000 | $261,200 |
| 2022 | $4,461 | $436,500 | $190,300 | $246,200 |
| 2021 | $4,355 | $385,700 | $173,000 | $212,700 |
| 2020 | $4,266 | $385,700 | $173,000 | $212,700 |
| 2019 | $4,285 | $367,200 | $148,300 | $218,900 |
| 2018 | $8,735 | $340,000 | $141,100 | $198,900 |
| 2017 | $3,670 | $304,800 | $135,800 | $169,000 |
| 2016 | $3,503 | $287,600 | $133,100 | $154,500 |
| 2015 | $3,443 | $283,400 | $133,100 | $150,300 |
Source: Public Records
Map
Nearby Homes
Your Personal Tour Guide
Ask me questions while you tour the home.