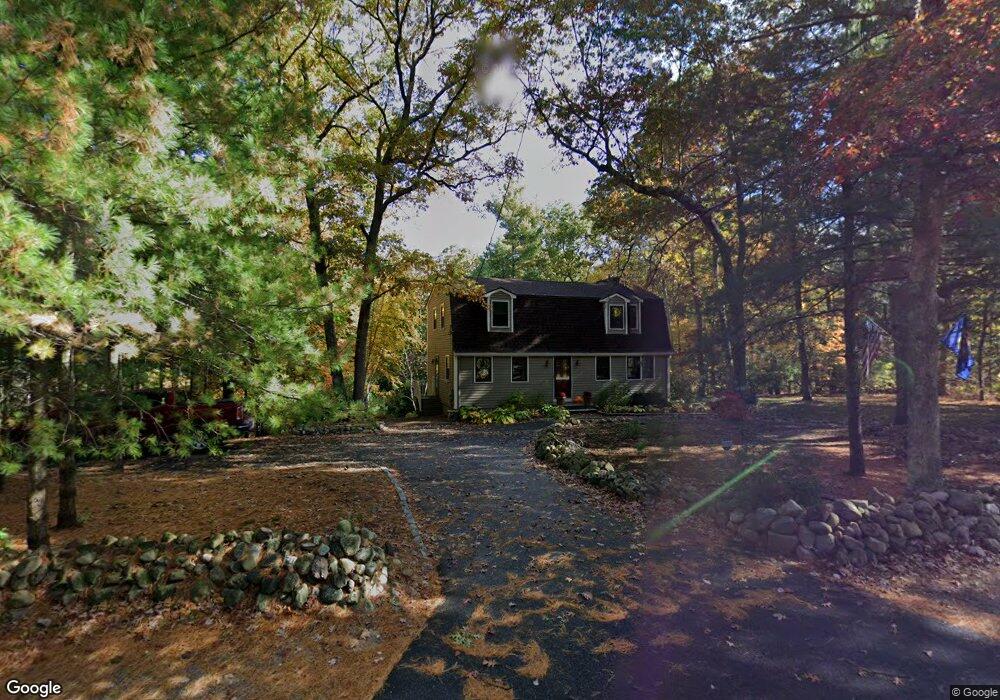
45 Green St Wrentham, MA 02093
Sheldonville NeighborhoodEstimated Value: $592,000 - $734,000
3
Beds
3
Baths
1,685
Sq Ft
$395/Sq Ft
Est. Value
About This Home
This home is located at 45 Green St, Wrentham, MA 02093 and is currently estimated at $665,093, approximately $394 per square foot. 45 Green St is a home located in Norfolk County with nearby schools including Delaney Elementary School, Charles E Roderick, and Mercymount Country Day School.
Ownership History
Date
Name
Owned For
Owner Type
Purchase Details
Closed on
Apr 27, 2007
Sold by
Goodwin Stephen L and Goodwin Marina S
Bought by
Moynihan Andrew J and Kilgallon Mary E
Current Estimated Value
Home Financials for this Owner
Home Financials are based on the most recent Mortgage that was taken out on this home.
Original Mortgage
$294,400
Outstanding Balance
$179,172
Interest Rate
6.18%
Mortgage Type
Purchase Money Mortgage
Estimated Equity
$485,921
Create a Home Valuation Report for This Property
The Home Valuation Report is an in-depth analysis detailing your home's value as well as a comparison with similar homes in the area
Home Values in the Area
Average Home Value in this Area
Purchase History
| Date | Buyer | Sale Price | Title Company |
|---|---|---|---|
| Moynihan Andrew J | $368,000 | -- |
Source: Public Records
Mortgage History
| Date | Status | Borrower | Loan Amount |
|---|---|---|---|
| Open | Moynihan Andrew J | $294,400 |
Source: Public Records
Tax History Compared to Growth
Tax History
| Year | Tax Paid | Tax Assessment Tax Assessment Total Assessment is a certain percentage of the fair market value that is determined by local assessors to be the total taxable value of land and additions on the property. | Land | Improvement |
|---|---|---|---|---|
| 2025 | $6,705 | $578,500 | $322,700 | $255,800 |
| 2024 | $6,468 | $539,000 | $322,700 | $216,300 |
| 2023 | $6,305 | $499,600 | $293,500 | $206,100 |
| 2022 | $5,617 | $410,900 | $233,800 | $177,100 |
| 2021 | $5,238 | $372,300 | $198,100 | $174,200 |
| 2020 | $5,180 | $363,500 | $164,000 | $199,500 |
| 2019 | $5,133 | $363,500 | $164,000 | $199,500 |
| 2018 | $5,064 | $355,600 | $163,800 | $191,800 |
| 2017 | $4,982 | $349,600 | $160,600 | $189,000 |
| 2016 | $4,768 | $333,900 | $156,000 | $177,900 |
| 2015 | $4,714 | $314,700 | $150,000 | $164,700 |
| 2014 | $4,636 | $302,800 | $144,200 | $158,600 |
Source: Public Records
Map
Nearby Homes
- 50 Green St
- 80 Carriage House Ln
- 1204 South St
- 1222 South St
- 440 Chestnut St
- 19 Chestnut Lot 0
- 791 South St Unit 5
- 4 Munroe Dr
- 11 Amber Dr
- 955 Summer St
- 12 Grant St
- 387 South St
- Lot 1 - Blueberry 2 Car Plan at King Philip Estates
- Lot 8 - Blueberry 2 Car Plan at King Philip Estates
- Lot 5 - Hughes 2 car Plan at King Philip Estates
- Lot 6 - Blueberry 3 Car Plan at King Philip Estates
- Lot 2 - Camden 2 Car Plan at King Philip Estates
- Lot 7 - Cedar Plan at King Philip Estates
- Lot 4 - Hemingway 2 Car Plan at King Philip Estates
- Lot 3 - Blueberry 2 Car Plan at King Philip Estates