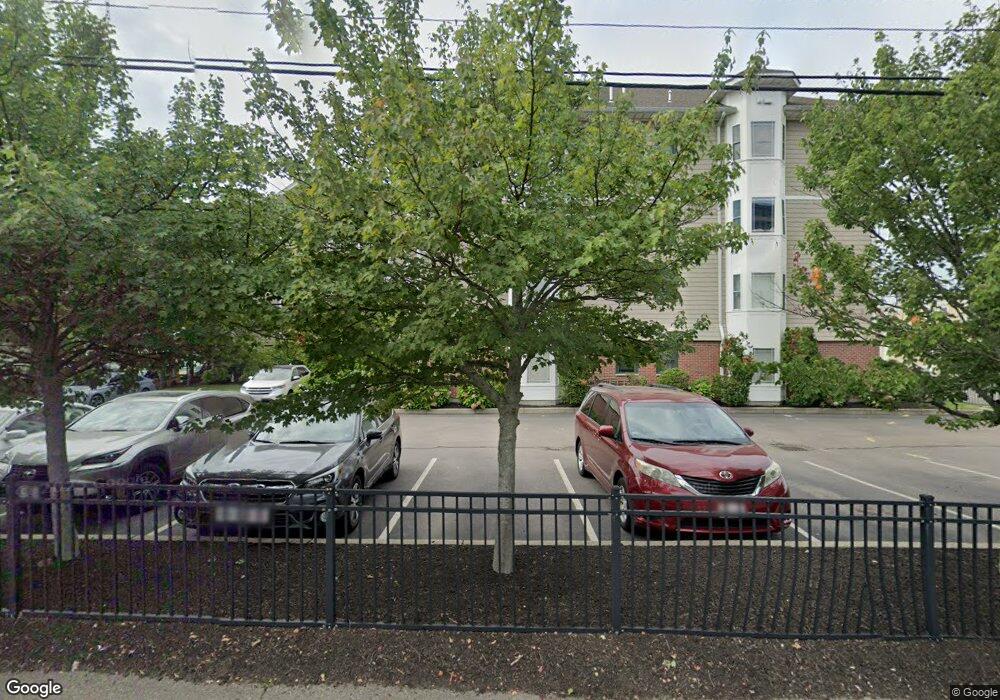
45 Hancock St Unit 103 Quincy, MA 02171
Montclair NeighborhoodEstimated Value: $619,938 - $719,000
3
Beds
2
Baths
1,284
Sq Ft
$526/Sq Ft
Est. Value
About This Home
This home is located at 45 Hancock St Unit 103, Quincy, MA 02171 and is currently estimated at $675,735, approximately $526 per square foot. 45 Hancock St Unit 103 is a home located in Norfolk County with nearby schools including Squantum Elementary School, Atlantic Middle School, and North Quincy High School.
Ownership History
Date
Name
Owned For
Owner Type
Purchase Details
Closed on
Jun 23, 2020
Sold by
Stevens Jason and Stevens Paula
Bought by
Stevens Paula
Current Estimated Value
Home Financials for this Owner
Home Financials are based on the most recent Mortgage that was taken out on this home.
Original Mortgage
$383,700
Interest Rate
3.1%
Mortgage Type
New Conventional
Purchase Details
Closed on
Dec 16, 2009
Sold by
Nq Dev Llc
Bought by
Stevens Jason and Stevens Paula
Purchase Details
Closed on
Jul 30, 2007
Sold by
Nq Dev Llc
Bought by
Stevens Jason and Stevens Paula
Home Financials for this Owner
Home Financials are based on the most recent Mortgage that was taken out on this home.
Original Mortgage
$299,920
Interest Rate
6.78%
Mortgage Type
Purchase Money Mortgage
Create a Home Valuation Report for This Property
The Home Valuation Report is an in-depth analysis detailing your home's value as well as a comparison with similar homes in the area
Home Values in the Area
Average Home Value in this Area
Purchase History
| Date | Buyer | Sale Price | Title Company |
|---|---|---|---|
| Stevens Paula | -- | None Available | |
| Stevens Jason | $374,900 | -- | |
| Stevens Jason | $374,900 | -- | |
| Stevens Jason | $374,900 | -- | |
| Stevens Jason | $374,900 | -- |
Source: Public Records
Mortgage History
| Date | Status | Borrower | Loan Amount |
|---|---|---|---|
| Previous Owner | Stevens Paula | $383,700 | |
| Previous Owner | Stevens Jason | $302,000 | |
| Previous Owner | Stevens Jason | $299,920 | |
| Previous Owner | Stevens Jason | $56,235 |
Source: Public Records
Tax History Compared to Growth
Tax History
| Year | Tax Paid | Tax Assessment Tax Assessment Total Assessment is a certain percentage of the fair market value that is determined by local assessors to be the total taxable value of land and additions on the property. | Land | Improvement |
|---|---|---|---|---|
| 2025 | $6,396 | $554,700 | $0 | $554,700 |
| 2024 | $5,993 | $531,800 | $0 | $531,800 |
| 2023 | $5,344 | $480,100 | $0 | $480,100 |
| 2022 | $5,737 | $478,900 | $0 | $478,900 |
| 2021 | $5,719 | $471,100 | $0 | $471,100 |
| 2020 | $5,636 | $453,400 | $0 | $453,400 |
| 2019 | $5,201 | $414,400 | $0 | $414,400 |
| 2018 | $5,135 | $384,900 | $0 | $384,900 |
| 2017 | $5,169 | $364,800 | $0 | $364,800 |
| 2016 | $5,023 | $349,800 | $0 | $349,800 |
| 2015 | $4,843 | $331,700 | $0 | $331,700 |
| 2014 | $4,703 | $316,500 | $0 | $316,500 |
Source: Public Records
Map
Nearby Homes
- 45 Hancock St Unit 203
- 60 Newbury St Unit 10
- 133 Commander Shea Blvd Unit 315
- 133 Commander Shea Blvd Unit 609
- 133 Commander Shea Blvd Unit 620
- 133 Commander Shea Blvd Unit 204
- 68 Atlantic St
- 90 Quincy Shore Dr Unit 701
- 90 Quincy Shore Dr Unit 501
- 90 Shore Ave
- 91 Atlantic St
- 138 Quincy Shore Dr Unit 170
- 148 Quincy Shore Dr Unit 43
- 166 Quincy Shore Dr Unit 108
- 400-412 Neponset Ave
- 62 Redfield St Unit 1
- 175 Quincy Shore Dr Unit B24
- 378 Neponset Ave
- 38 Walker St
- 212 Quincy Shore Dr
- 45 Hancock St Unit 406
- 45 Hancock St Unit 405
- 45 Hancock St Unit 404
- 45 Hancock St Unit 403
- 45 Hancock St Unit 402
- 45 Hancock St Unit 401
- 45 Hancock St Unit 306
- 45 Hancock St Unit 305
- 45 Hancock St Unit 304
- 45 Hancock St Unit 303
- 45 Hancock St Unit 302
- 45 Hancock St Unit 301
- 45 Hancock St Unit 206
- 45 Hancock St Unit 205
- 45 Hancock St Unit 204
- 45 Hancock St Unit 202
- 45 Hancock St Unit 201
- 45 Hancock St Unit 106
- 45 Hancock St Unit 105
- 45 Hancock St Unit 104