Estimated Value: $614,000 - $798,050
4
Beds
3
Baths
2,069
Sq Ft
$343/Sq Ft
Est. Value
About This Home
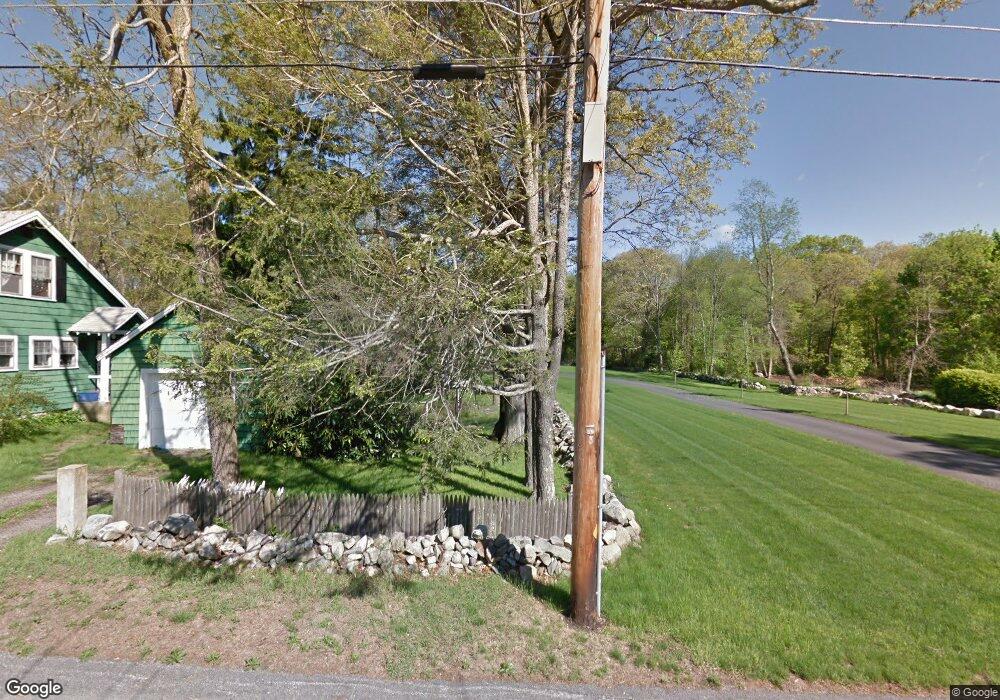
This home is located at 45 Highland St, Avon, MA 02322 and is currently estimated at $709,763, approximately $343 per square foot. 45 Highland St is a home located in Norfolk County with nearby schools including Ralph D. Butler Elementary School and Avon Middle/High School.
Ownership History
Date
Name
Owned For
Owner Type
Purchase Details
Closed on
Nov 9, 2009
Sold by
Zienko Christopher M
Bought by
Austrino Michael J and Austrino Jennifer M
Current Estimated Value
Home Financials for this Owner
Home Financials are based on the most recent Mortgage that was taken out on this home.
Original Mortgage
$250,000
Outstanding Balance
$163,740
Interest Rate
5.06%
Mortgage Type
Purchase Money Mortgage
Estimated Equity
$546,023
Create a Home Valuation Report for This Property
The Home Valuation Report is an in-depth analysis detailing your home's value as well as a comparison with similar homes in the area
Home Values in the Area
Average Home Value in this Area
Purchase History
| Date | Buyer | Sale Price | Title Company |
|---|---|---|---|
| Austrino Michael J | $95,000 | -- |
Source: Public Records
Mortgage History
| Date | Status | Borrower | Loan Amount |
|---|---|---|---|
| Open | Austrino Michael J | $250,000 |
Source: Public Records
Tax History Compared to Growth
Tax History
| Year | Tax Paid | Tax Assessment Tax Assessment Total Assessment is a certain percentage of the fair market value that is determined by local assessors to be the total taxable value of land and additions on the property. | Land | Improvement |
|---|---|---|---|---|
| 2025 | $104 | $780,400 | $249,100 | $531,300 |
| 2024 | $9,894 | $705,200 | $231,600 | $473,600 |
| 2023 | $9,605 | $705,200 | $231,600 | $473,600 |
| 2022 | $9,750 | $616,700 | $194,200 | $422,500 |
| 2021 | $8,298 | $494,500 | $176,300 | $318,200 |
| 2020 | $8,314 | $469,700 | $172,800 | $296,900 |
| 2019 | $8,234 | $457,700 | $165,400 | $292,300 |
| 2018 | $8,403 | $453,000 | $165,400 | $287,600 |
| 2017 | $6,788 | $392,800 | $165,400 | $227,400 |
| 2016 | $6,779 | $396,200 | $157,600 | $238,600 |
| 2015 | $6,212 | $379,500 | $150,600 | $228,900 |
Source: Public Records
Map
Nearby Homes