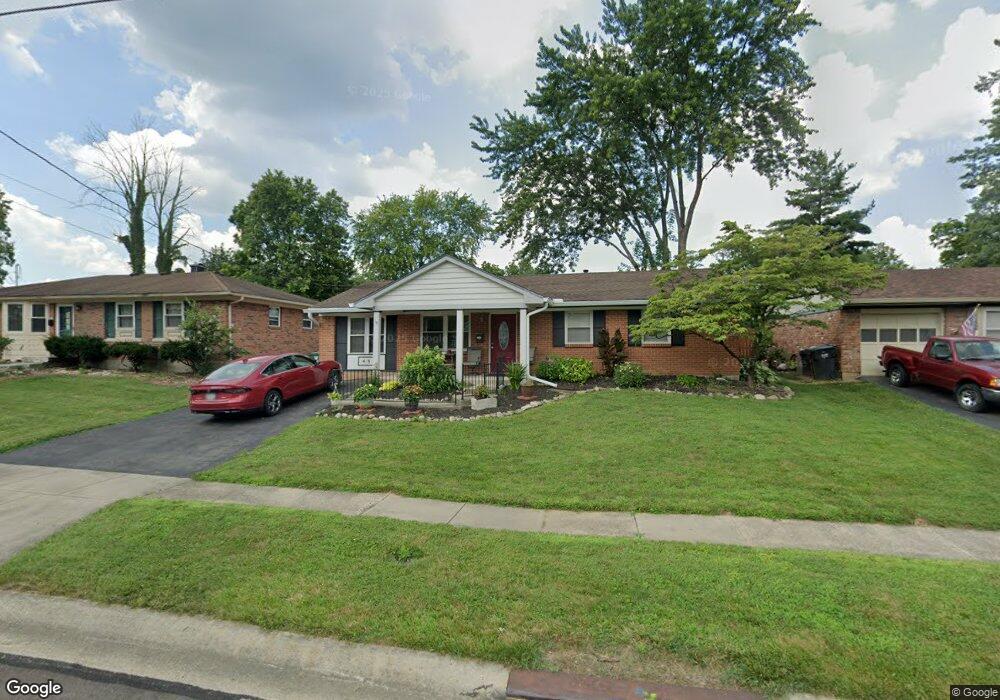
45 Highridge Dr Loveland, OH 45140
Estimated Value: $242,300 - $288,000
3
Beds
2
Baths
1,269
Sq Ft
$208/Sq Ft
Est. Value
About This Home
This home is located at 45 Highridge Dr, Loveland, OH 45140 and is currently estimated at $263,575, approximately $207 per square foot. 45 Highridge Dr is a home located in Hamilton County with nearby schools including Loveland Intermediate School, Loveland Primary School, and Loveland Elementary School.
Ownership History
Date
Name
Owned For
Owner Type
Purchase Details
Closed on
Aug 14, 2009
Sold by
Leigh Scott D and Leigh David J
Bought by
Erdman Rebecca
Current Estimated Value
Home Financials for this Owner
Home Financials are based on the most recent Mortgage that was taken out on this home.
Original Mortgage
$122,735
Outstanding Balance
$80,350
Interest Rate
5.29%
Mortgage Type
FHA
Estimated Equity
$183,225
Purchase Details
Closed on
Mar 3, 2009
Sold by
Federal Home Loan Mortgage Corporation
Bought by
Leigh Scott D and Leigh David J
Home Financials for this Owner
Home Financials are based on the most recent Mortgage that was taken out on this home.
Original Mortgage
$65,365
Interest Rate
5.09%
Mortgage Type
Future Advance Clause Open End Mortgage
Purchase Details
Closed on
Jan 22, 2009
Sold by
Cutter Alice M and Cutter Alice Mcquitty
Bought by
Federal Home Loan Mortgage Corp
Home Financials for this Owner
Home Financials are based on the most recent Mortgage that was taken out on this home.
Original Mortgage
$65,365
Interest Rate
5.09%
Mortgage Type
Future Advance Clause Open End Mortgage
Create a Home Valuation Report for This Property
The Home Valuation Report is an in-depth analysis detailing your home's value as well as a comparison with similar homes in the area
Home Values in the Area
Average Home Value in this Area
Purchase History
| Date | Buyer | Sale Price | Title Company |
|---|---|---|---|
| Erdman Rebecca | $125,000 | Attorney | |
| Leigh Scott D | $66,900 | Attorney | |
| Federal Home Loan Mortgage Corp | $76,000 | None Available |
Source: Public Records
Mortgage History
| Date | Status | Borrower | Loan Amount |
|---|---|---|---|
| Open | Erdman Rebecca | $122,735 | |
| Previous Owner | Leigh Scott D | $65,365 |
Source: Public Records
Tax History Compared to Growth
Tax History
| Year | Tax Paid | Tax Assessment Tax Assessment Total Assessment is a certain percentage of the fair market value that is determined by local assessors to be the total taxable value of land and additions on the property. | Land | Improvement |
|---|---|---|---|---|
| 2024 | $3,005 | $57,005 | $16,734 | $40,271 |
| 2023 | $3,090 | $57,005 | $16,734 | $40,271 |
| 2022 | $2,681 | $41,479 | $8,845 | $32,634 |
| 2021 | $2,544 | $41,479 | $8,845 | $32,634 |
| 2020 | $2,584 | $41,479 | $8,845 | $32,634 |
| 2019 | $2,363 | $35,452 | $7,560 | $27,892 |
| 2018 | $2,377 | $35,452 | $7,560 | $27,892 |
| 2017 | $2,254 | $35,452 | $7,560 | $27,892 |
| 2016 | $2,788 | $42,000 | $7,259 | $34,741 |
| 2015 | $2,819 | $42,000 | $7,259 | $34,741 |
| 2014 | $2,886 | $42,000 | $7,259 | $34,741 |
| 2013 | $3,149 | $43,750 | $7,560 | $36,190 |
Source: Public Records
Map
Nearby Homes
- 6 Ridge Cir
- 736 Mohican Dr
- 508 Navaho Dr
- 20 Miamiview Dr
- 228 Tuscarora Dr
- 1008 W Main St
- 1000 Valley View Ln
- 104 Cherokee Dr
- Lot 1 Florence Ave
- 800 Florence Ave
- 487 Pintail Dr
- 814 Oak Canyon Dr
- 1306 W Loveland Ave
- 621 W Loveland Ave
- 619 W Loveland Ave
- 617 W Loveland Ave
- 6762 Epworth Rd
- 882 Quailwoods Dr
- 6350 Trail Ridge Ct
- 703 Miami View Ct
- 47 Highridge Dr
- 43 Highridge Dr
- 43 Hjighridge Dr
- 49 Highridge Dr
- 41 Highridge Dr
- 755 Mohican Dr
- 749 Mohican Dr
- 761 Mohican Dr
- 8 Ridge Cir
- 801 Mohican Dr
- 75 Highridge Dr
- 743 Mohican Dr
- 51 Highridge Dr
- 39 Highridge Dr
- 38 Highridge Dr
- 807 Mohican Dr
- 737 Mohican Dr
- 1 Ridge Cir
- 7 Ridge Cir
- 53 Highridge Dr