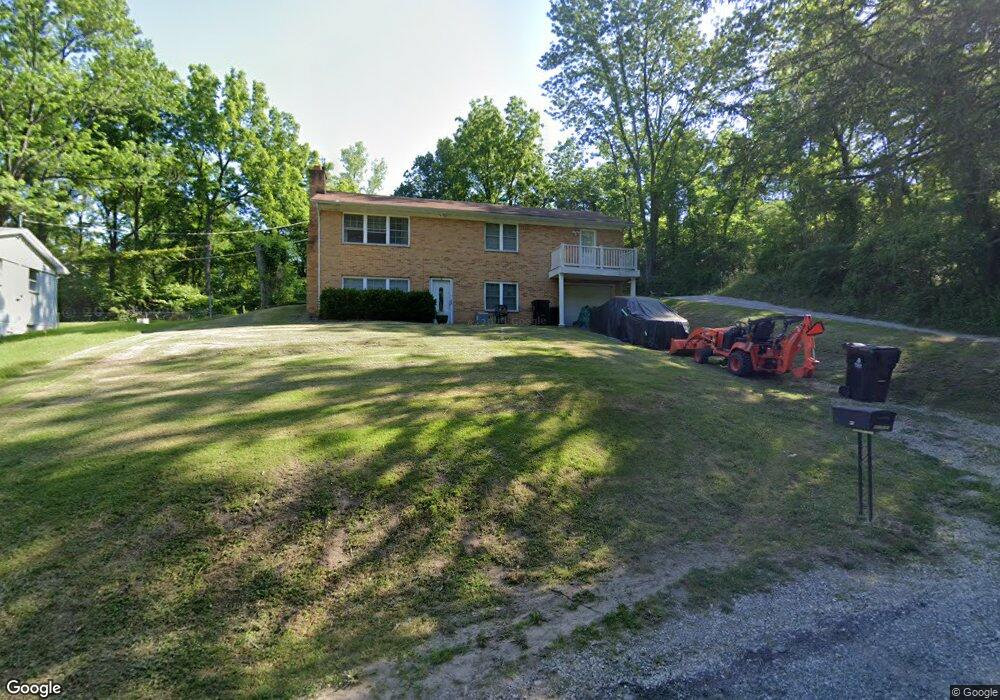
45 Highview Ln Belleville, IL 62223
Estimated Value: $130,000 - $157,032
Studio
--
Bath
1,012
Sq Ft
$144/Sq Ft
Est. Value
About This Home
This home is located at 45 Highview Ln, Belleville, IL 62223 and is currently estimated at $145,758, approximately $144 per square foot. 45 Highview Ln is a home located in St. Clair County with nearby schools including Katie Harper-Wright Elementary School, Mason/Clark Middle School, and East St Louis Senior High School.
Ownership History
Date
Name
Owned For
Owner Type
Purchase Details
Closed on
Mar 7, 2008
Sold by
S & J Of Waterloo Inc
Bought by
Highview Land Trust 45
Current Estimated Value
Purchase Details
Closed on
Jul 21, 2005
Sold by
Liquidation Properties Inc
Bought by
S & J Of Waterloo
Purchase Details
Closed on
Jun 24, 2004
Sold by
Union Planters Bank Na
Bought by
Liquidation Properties Inc
Purchase Details
Closed on
Jun 19, 2003
Sold by
Crockett Stanley R and Crockett Benita A
Bought by
Union Planters Bank Na
Create a Home Valuation Report for This Property
The Home Valuation Report is an in-depth analysis detailing your home's value as well as a comparison with similar homes in the area
Home Values in the Area
Average Home Value in this Area
Purchase History
| Date | Buyer | Sale Price | Title Company |
|---|---|---|---|
| Highview Land Trust 45 | -- | Town & Country Title Co | |
| S & J Of Waterloo | $35,500 | Fatic | |
| Liquidation Properties Inc | -- | -- | |
| Union Planters Bank Na | $57,891 | -- |
Source: Public Records
Tax History
| Year | Tax Paid | Tax Assessment Tax Assessment Total Assessment is a certain percentage of the fair market value that is determined by local assessors to be the total taxable value of land and additions on the property. | Land | Improvement |
|---|---|---|---|---|
| 2024 | $3,706 | $39,921 | $3,543 | $36,378 |
| 2023 | $3,026 | $33,565 | $3,473 | $30,092 |
| 2022 | $2,551 | $30,217 | $3,127 | $27,090 |
| 2021 | $2,324 | $27,935 | $2,891 | $25,044 |
| 2020 | $2,311 | $26,417 | $2,734 | $23,683 |
| 2019 | $2,182 | $25,021 | $2,738 | $22,283 |
| 2018 | $2,186 | $24,480 | $2,679 | $21,801 |
| 2017 | $1,938 | $24,308 | $2,660 | $21,648 |
| 2016 | $1,641 | $23,792 | $2,603 | $21,189 |
| 2014 | $4,122 | $26,406 | $2,618 | $23,788 |
| 2013 | $2,542 | $26,783 | $2,655 | $24,128 |
Source: Public Records
Map
Nearby Homes
Your Personal Tour Guide
Ask me questions while you tour the home.