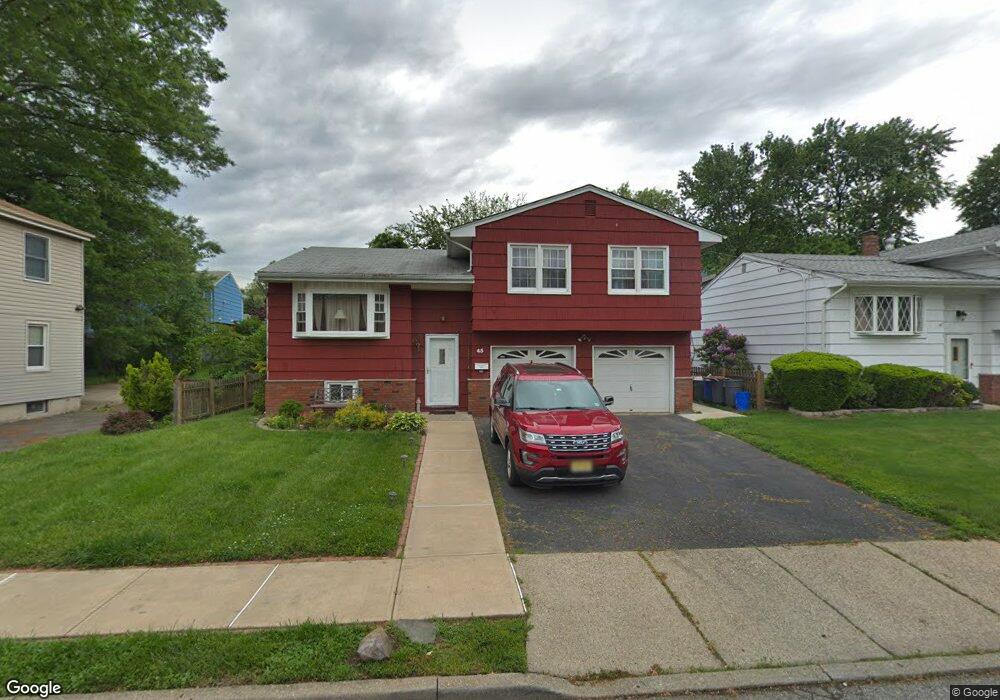
45 Hobson St Bloomfield, NJ 07003
Estimated Value: $554,737 - $657,000
Studio
--
Bath
1,459
Sq Ft
$415/Sq Ft
Est. Value
About This Home
This home is located at 45 Hobson St, Bloomfield, NJ 07003 and is currently estimated at $605,184, approximately $414 per square foot. 45 Hobson St is a home located in Essex County with nearby schools including Demarest School, Bloomfield Middle School, and Bloomfield High School.
Ownership History
Date
Name
Owned For
Owner Type
Purchase Details
Closed on
May 6, 2016
Sold by
Lois David D and Rossi Lois Maria
Bought by
Lois David D and Rossi Maria O
Current Estimated Value
Home Financials for this Owner
Home Financials are based on the most recent Mortgage that was taken out on this home.
Original Mortgage
$394,739
Outstanding Balance
$316,372
Interest Rate
3.87%
Mortgage Type
FHA
Estimated Equity
$288,812
Purchase Details
Closed on
Oct 15, 2003
Sold by
Miller Joyce
Bought by
Lois Maria Rossi and Lois David
Home Financials for this Owner
Home Financials are based on the most recent Mortgage that was taken out on this home.
Original Mortgage
$239,120
Interest Rate
5.98%
Create a Home Valuation Report for This Property
The Home Valuation Report is an in-depth analysis detailing your home's value as well as a comparison with similar homes in the area
Home Values in the Area
Average Home Value in this Area
Purchase History
| Date | Buyer | Sale Price | Title Company |
|---|---|---|---|
| Lois David D | -- | None Available | |
| Lois Maria Rossi | $298,900 | -- |
Source: Public Records
Mortgage History
| Date | Status | Borrower | Loan Amount |
|---|---|---|---|
| Open | Lois David D | $394,739 | |
| Closed | Lois Maria Rossi | $239,120 |
Source: Public Records
Tax History
| Year | Tax Paid | Tax Assessment Tax Assessment Total Assessment is a certain percentage of the fair market value that is determined by local assessors to be the total taxable value of land and additions on the property. | Land | Improvement |
|---|---|---|---|---|
| 2025 | $12,262 | $361,500 | $146,100 | $221,500 |
| 2024 | $11,814 | $361,500 | $146,100 | $221,500 |
| 2022 | $11,575 | $361,500 | $0 | $0 |
| 2021 | $11,362 | $361,500 | $146,100 | $215,400 |
| 2020 | $11,188 | $361,500 | $146,100 | $215,400 |
| 2019 | $11,971 | $300,700 | $144,000 | $156,700 |
| 2018 | $11,920 | $300,700 | $144,000 | $156,700 |
| 2017 | $11,739 | $300,700 | $144,000 | $156,700 |
| 2016 | $11,607 | $300,700 | $144,000 | $156,700 |
| 2015 | $11,502 | $300,700 | $144,000 | $156,700 |
| 2014 | $10,953 | $300,700 | $144,000 | $156,700 |
Source: Public Records
Map
Nearby Homes
Your Personal Tour Guide
Ask me questions while you tour the home.