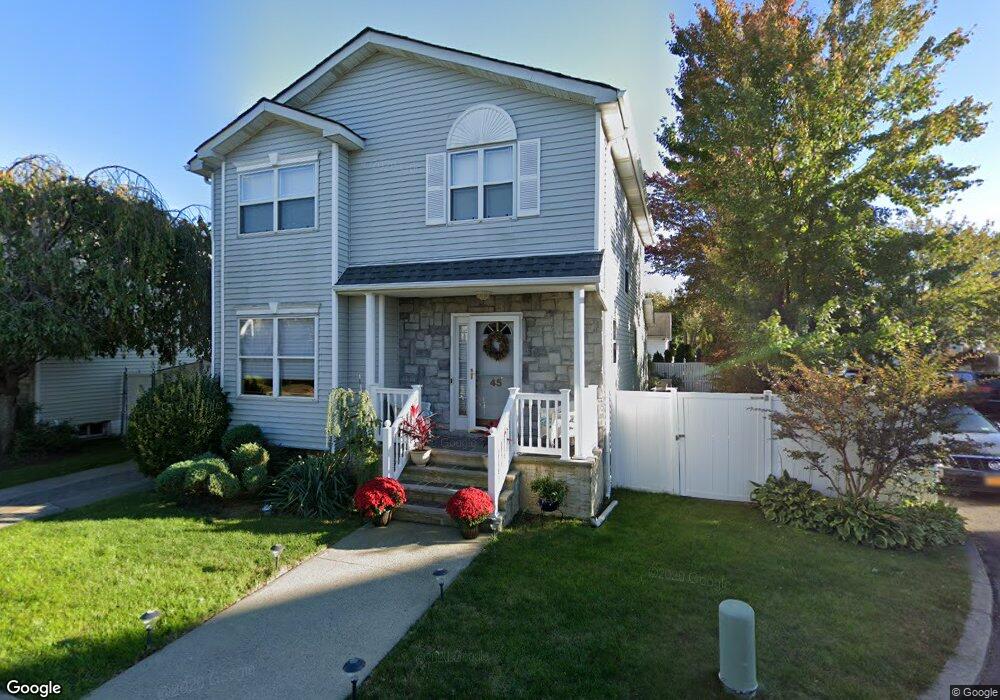
45 Honey Ln Staten Island, NY 10307
Tottenville NeighborhoodEstimated Value: $728,000 - $1,057,000
--
Bed
--
Bath
1,704
Sq Ft
$500/Sq Ft
Est. Value
About This Home
This home is located at 45 Honey Ln, Staten Island, NY 10307 and is currently estimated at $851,411, approximately $499 per square foot. 45 Honey Ln is a home located in Richmond County with nearby schools including P.S. 6 Cpl Allan F Kivlehan School, Is 34 Tottenville, and Tottenville High School.
Ownership History
Date
Name
Owned For
Owner Type
Purchase Details
Closed on
Jan 16, 1998
Sold by
Johnson David P and Johnson Nancy
Bought by
Bachman Miriam A and Randazzo Lucille
Current Estimated Value
Purchase Details
Closed on
Sep 5, 1995
Sold by
Jeffrey Associates
Bought by
Johnson David P and Johnson Nancy
Home Financials for this Owner
Home Financials are based on the most recent Mortgage that was taken out on this home.
Original Mortgage
$150,000
Interest Rate
6.25%
Create a Home Valuation Report for This Property
The Home Valuation Report is an in-depth analysis detailing your home's value as well as a comparison with similar homes in the area
Home Values in the Area
Average Home Value in this Area
Purchase History
| Date | Buyer | Sale Price | Title Company |
|---|---|---|---|
| Bachman Miriam A | $260,000 | -- | |
| Johnson David P | $253,500 | -- |
Source: Public Records
Mortgage History
| Date | Status | Borrower | Loan Amount |
|---|---|---|---|
| Previous Owner | Johnson David P | $150,000 |
Source: Public Records
Tax History Compared to Growth
Tax History
| Year | Tax Paid | Tax Assessment Tax Assessment Total Assessment is a certain percentage of the fair market value that is determined by local assessors to be the total taxable value of land and additions on the property. | Land | Improvement |
|---|---|---|---|---|
| 2025 | $7,736 | $46,200 | $11,210 | $34,990 |
| 2024 | $7,748 | $40,320 | $12,118 | $28,202 |
| 2023 | $7,822 | $39,917 | $11,600 | $28,317 |
| 2022 | $7,388 | $42,480 | $12,240 | $30,240 |
| 2021 | $7,463 | $36,900 | $12,240 | $24,660 |
| 2020 | $7,167 | $40,800 | $12,240 | $28,560 |
| 2019 | $6,666 | $41,400 | $12,240 | $29,160 |
| 2018 | $6,483 | $33,264 | $8,689 | $24,575 |
| 2017 | $6,232 | $32,040 | $11,059 | $20,981 |
| 2016 | $5,916 | $31,145 | $11,854 | $19,291 |
| 2015 | $5,015 | $29,383 | $9,442 | $19,941 |
| 2014 | $5,015 | $27,720 | $10,200 | $17,520 |
Source: Public Records
Map
Nearby Homes