45 Hutchinson Rd Unit Zuber Rd Riverton, WY 82501
Estimated Value: $293,000 - $477,000
4
Beds
3
Baths
2,838
Sq Ft
$150/Sq Ft
Est. Value
About This Home
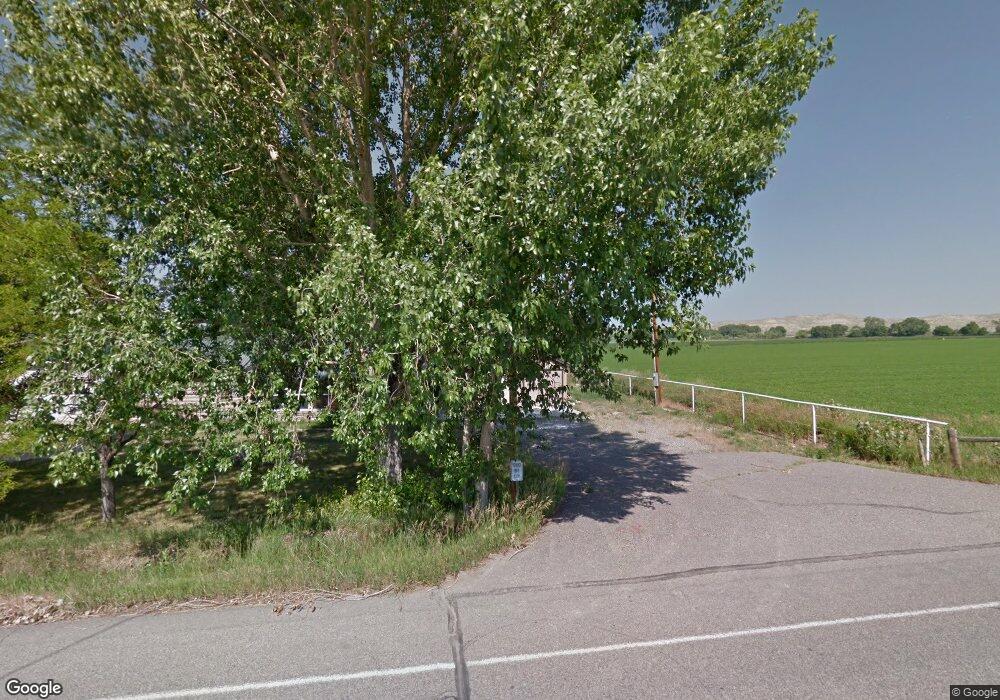
This home is located at 45 Hutchinson Rd Unit Zuber Rd, Riverton, WY 82501 and is currently estimated at $425,769, approximately $150 per square foot. 45 Hutchinson Rd Unit Zuber Rd is a home located in Fremont County with nearby schools including Riverton High School.
Ownership History
Date
Name
Owned For
Owner Type
Purchase Details
Closed on
Jul 29, 2021
Sold by
Blumenshine Brian J and Blumenshine Tara N
Bought by
Senter Sean C and Senter Kelly L
Current Estimated Value
Home Financials for this Owner
Home Financials are based on the most recent Mortgage that was taken out on this home.
Original Mortgage
$319,176
Outstanding Balance
$290,230
Interest Rate
2.9%
Mortgage Type
VA
Estimated Equity
$135,539
Purchase Details
Closed on
Jun 30, 2010
Sold by
Byerly Ashley A and Thompson Ashley A
Bought by
Blumenshine Brian J and Blumenshine Tara N
Purchase Details
Closed on
Aug 20, 2006
Sold by
Laselle Bank National Association
Bought by
Thompson Ashley A and Hyerly Tedd A
Home Financials for this Owner
Home Financials are based on the most recent Mortgage that was taken out on this home.
Original Mortgage
$102,066
Interest Rate
6.79%
Mortgage Type
Purchase Money Mortgage
Purchase Details
Closed on
May 19, 2006
Sold by
Parrist Ren H
Bought by
Lasalle Bank Na
Create a Home Valuation Report for This Property
The Home Valuation Report is an in-depth analysis detailing your home's value as well as a comparison with similar homes in the area
Home Values in the Area
Average Home Value in this Area
Purchase History
| Date | Buyer | Sale Price | Title Company |
|---|---|---|---|
| Senter Sean C | -- | None Listed On Document | |
| Blumenshine Brian J | -- | County Title Inc | |
| Thompson Ashley A | -- | None Available | |
| Lasalle Bank Na | $120,638 | None Available |
Source: Public Records
Mortgage History
| Date | Status | Borrower | Loan Amount |
|---|---|---|---|
| Open | Senter Sean C | $319,176 | |
| Previous Owner | Thompson Ashley A | $102,066 |
Source: Public Records
Tax History Compared to Growth
Tax History
| Year | Tax Paid | Tax Assessment Tax Assessment Total Assessment is a certain percentage of the fair market value that is determined by local assessors to be the total taxable value of land and additions on the property. | Land | Improvement |
|---|---|---|---|---|
| 2025 | $2,861 | $34,754 | $4,184 | $30,570 |
| 2024 | $2,861 | $39,050 | $5,364 | $33,686 |
| 2023 | $2,836 | $37,905 | $5,364 | $32,541 |
| 2022 | $2,467 | $33,720 | $3,080 | $30,640 |
| 2021 | $2,284 | $30,276 | $3,080 | $27,196 |
| 2020 | $2,152 | $28,542 | $3,080 | $25,462 |
| 2019 | $2,178 | $29,595 | $2,727 | $26,868 |
| 2018 | $1,196 | $16,285 | $2,727 | $13,558 |
| 2017 | $1,297 | $16,196 | $2,727 | $13,469 |
| 2016 | $1,327 | $16,787 | $2,727 | $14,060 |
| 2015 | $1,186 | $16,292 | $2,727 | $13,565 |
| 2014 | $1,330 | $17,951 | $3,230 | $14,721 |
Source: Public Records
Map
Nearby Homes
- 107 Hutchinson Rd
- 17 Sarah Dr
- 0 Burma Lot 3 Rd Unit 20252427
- 0 Burma Lot 1 Rd
- 0 Burma Lot 2 Rd Unit 20252425
- 48 Cliff Dr
- 94 Cliff Dr
- 94 Cliff 15 A Dr
- 000 Glen Dr
- 29 33 Ranch Rd
- Lot 3 & 4 Mazet Rd
- 145 Mazet Rd
- 51 Farview Cir
- 181 Mazet Rd
- 47 Minter Ln
- Mazet Rd
- 0 N Federal Lot C-13 Blvd
- 41 Crow St
- 41 Sage Dr
- 338 Gas Hills Rd
- 45 Hutchinson Rd Unit Hwy 789
- 45 Hutchinson Rd
- 37 Hutchinson Rd
- 39 Hutchinson Rd
- 28 Zuber Rd
- 69 Hutchinson Rd
- 6 Zuber Rd
- 70 Hutchinson Rd Unit HWY 789
- 1 Zuber Rd
- 90 Zuber Rd
- 9 Silver Star Ln
- 12 Hutchinson Rd
- 9 Hutchinson Rd
- 58 Zuber Rd Unit Burma
- 55 Zuber Rd
- 11070 Highway 789
- 11072 Highway 789
- 0000 Zuber Rd
- 15 Silver Star Ln
- 11062 Highway 789