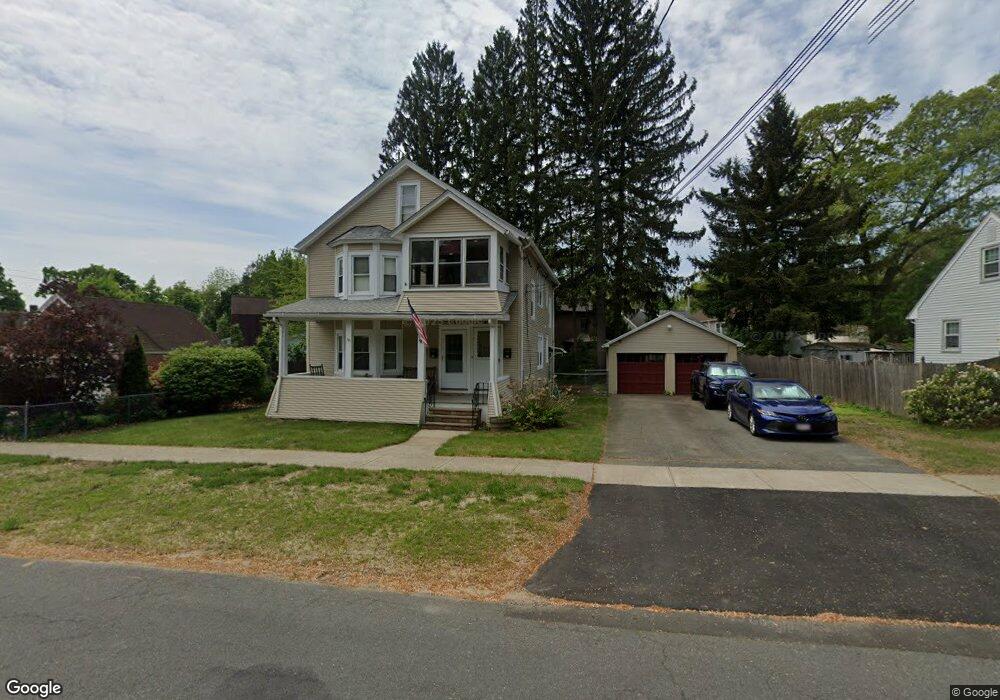
45 Janet St Unit 47 West Springfield, MA 01089
Estimated Value: $382,000 - $462,000
4
Beds
2
Baths
2,092
Sq Ft
$194/Sq Ft
Est. Value
About This Home
This home is located at 45 Janet St Unit 47, West Springfield, MA 01089 and is currently estimated at $406,848, approximately $194 per square foot. 45 Janet St Unit 47 is a home located in Hampden County with nearby schools including St Thomas The Apostle School.
Ownership History
Date
Name
Owned For
Owner Type
Purchase Details
Closed on
Jun 26, 2024
Sold by
Lukowiak James and Gawle Ryan D
Bought by
St Amand Brian P
Current Estimated Value
Purchase Details
Closed on
Sep 15, 2014
Sold by
Gawle Ryan D and Gawle Heather L
Bought by
Gawle Ryan D
Purchase Details
Closed on
Dec 23, 2009
Sold by
Dilorenzo Vincent and Dilorenzo Carol Ann
Bought by
Gawle Ryan D and Gawle Heather L
Home Financials for this Owner
Home Financials are based on the most recent Mortgage that was taken out on this home.
Original Mortgage
$210,429
Interest Rate
4.92%
Mortgage Type
Purchase Money Mortgage
Create a Home Valuation Report for This Property
The Home Valuation Report is an in-depth analysis detailing your home's value as well as a comparison with similar homes in the area
Home Values in the Area
Average Home Value in this Area
Purchase History
| Date | Buyer | Sale Price | Title Company |
|---|---|---|---|
| St Amand Brian P | $260,000 | None Available | |
| St Amand Brian P | $260,000 | None Available | |
| Gawle Ryan D | -- | -- | |
| Gawle Ryan D | -- | -- | |
| Gawle Ryan D | $206,000 | -- | |
| Gawle Ryan D | $206,000 | -- |
Source: Public Records
Mortgage History
| Date | Status | Borrower | Loan Amount |
|---|---|---|---|
| Previous Owner | Gawle Ryan D | $209,209 | |
| Previous Owner | Gawle Ryan D | $210,429 |
Source: Public Records
Tax History Compared to Growth
Tax History
| Year | Tax Paid | Tax Assessment Tax Assessment Total Assessment is a certain percentage of the fair market value that is determined by local assessors to be the total taxable value of land and additions on the property. | Land | Improvement |
|---|---|---|---|---|
| 2025 | $4,189 | $281,700 | $106,700 | $175,000 |
| 2024 | $4,276 | $288,700 | $106,700 | $182,000 |
| 2023 | $4,035 | $258,100 | $106,700 | $151,400 |
| 2022 | $3,913 | $248,300 | $96,900 | $151,400 |
| 2021 | $3,395 | $200,900 | $88,600 | $112,300 |
| 2020 | $3,403 | $200,300 | $88,600 | $111,700 |
| 2019 | $3,397 | $200,300 | $88,600 | $111,700 |
| 2018 | $3,415 | $200,300 | $88,600 | $111,700 |
| 2017 | $3,415 | $200,300 | $88,600 | $111,700 |
| 2016 | $3,345 | $196,900 | $85,200 | $111,700 |
| 2015 | $3,282 | $193,200 | $83,500 | $109,700 |
| 2014 | $3,170 | $193,200 | $83,500 | $109,700 |
Source: Public Records
Map
Nearby Homes