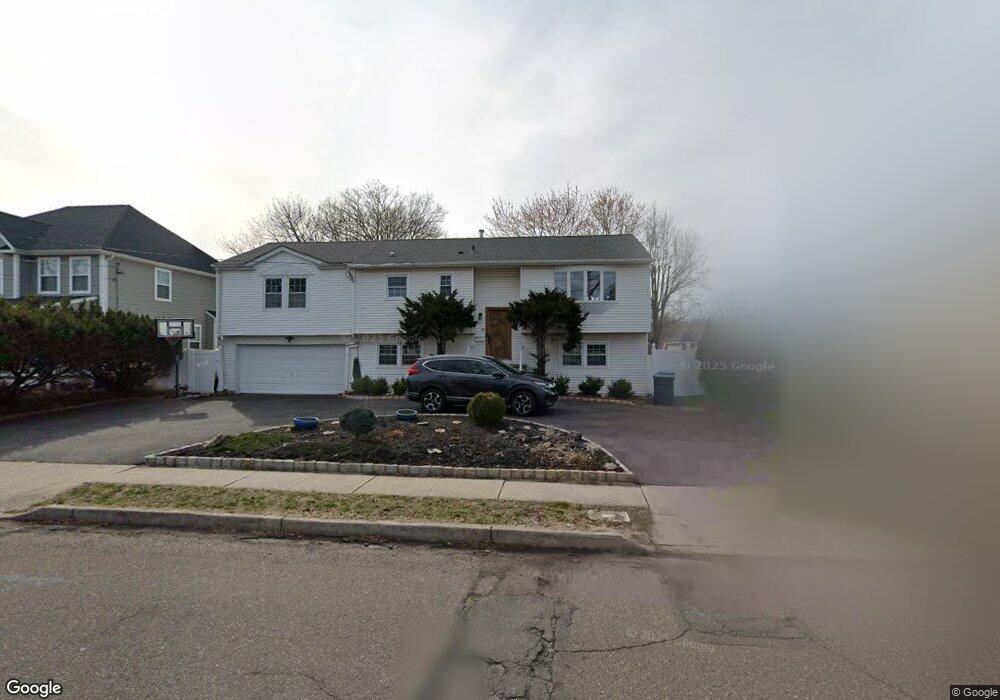
45 John St Metuchen, NJ 08840
Estimated Value: $701,000 - $837,179
Studio
--
Bath
1,448
Sq Ft
$530/Sq Ft
Est. Value
About This Home
This home is located at 45 John St, Metuchen, NJ 08840 and is currently estimated at $768,045, approximately $530 per square foot. 45 John St is a home located in Middlesex County with nearby schools including Campbell Elementary School, Edgar Middle School, and Metuchen High School.
Ownership History
Date
Name
Owned For
Owner Type
Purchase Details
Closed on
Mar 7, 2002
Sold by
Nielsen Gilbert
Bought by
Paydar Construction
Current Estimated Value
Purchase Details
Closed on
Sep 21, 2001
Sold by
Paydar Saeed
Bought by
Trehan Brijesh and Trehan Mayuri
Home Financials for this Owner
Home Financials are based on the most recent Mortgage that was taken out on this home.
Original Mortgage
$231,200
Interest Rate
6.93%
Purchase Details
Closed on
May 23, 2000
Sold by
Crane William
Bought by
Paydar Saeed
Create a Home Valuation Report for This Property
The Home Valuation Report is an in-depth analysis detailing your home's value as well as a comparison with similar homes in the area
Home Values in the Area
Average Home Value in this Area
Purchase History
| Date | Buyer | Sale Price | Title Company |
|---|---|---|---|
| Paydar Construction | $105,000 | -- | |
| Trehan Brijesh | $289,000 | -- | |
| Paydar Saeed | $65,000 | -- |
Source: Public Records
Mortgage History
| Date | Status | Borrower | Loan Amount |
|---|---|---|---|
| Previous Owner | Trehan Brijesh | $231,200 |
Source: Public Records
Tax History
| Year | Tax Paid | Tax Assessment Tax Assessment Total Assessment is a certain percentage of the fair market value that is determined by local assessors to be the total taxable value of land and additions on the property. | Land | Improvement |
|---|---|---|---|---|
| 2025 | $15,301 | $220,000 | $81,200 | $138,800 |
| 2024 | $14,788 | $220,000 | $81,200 | $138,800 |
Source: Public Records
Map
Nearby Homes
Your Personal Tour Guide
Ask me questions while you tour the home.