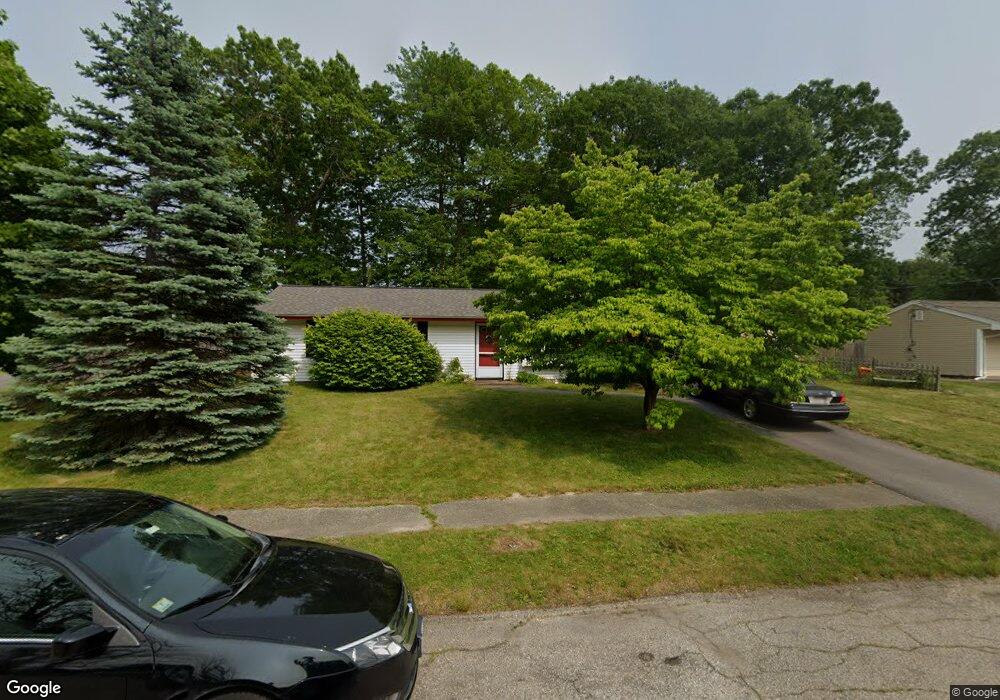
45 Juneau Rd Brockton, MA 02302
Estimated Value: $442,827 - $504,000
3
Beds
1
Bath
1,204
Sq Ft
$387/Sq Ft
Est. Value
About This Home
This home is located at 45 Juneau Rd, Brockton, MA 02302 and is currently estimated at $466,207, approximately $387 per square foot. 45 Juneau Rd is a home located in Plymouth County with nearby schools including Gilmore Elementary School, Davis K-8 School, and John F. Kennedy Elementary School.
Ownership History
Date
Name
Owned For
Owner Type
Purchase Details
Closed on
Jul 2, 2025
Sold by
Sokol Christopher P
Bought by
Christopher P Sokol Lt and Sokol
Current Estimated Value
Purchase Details
Closed on
May 29, 1987
Sold by
Rollins Richard
Bought by
Sokol Christopher P
Home Financials for this Owner
Home Financials are based on the most recent Mortgage that was taken out on this home.
Original Mortgage
$109,250
Interest Rate
10.25%
Mortgage Type
Purchase Money Mortgage
Create a Home Valuation Report for This Property
The Home Valuation Report is an in-depth analysis detailing your home's value as well as a comparison with similar homes in the area
Purchase History
| Date | Buyer | Sale Price | Title Company |
|---|---|---|---|
| Christopher P Sokol Lt | -- | -- | |
| Christopher P Sokol Lt | -- | -- | |
| Sokol Christopher P | $115,000 | -- |
Source: Public Records
Mortgage History
| Date | Status | Borrower | Loan Amount |
|---|---|---|---|
| Previous Owner | Sokol Christopher P | $60,000 | |
| Previous Owner | Sokol Christopher P | $67,800 | |
| Previous Owner | Sokol Christopher P | $109,250 |
Source: Public Records
Tax History
| Year | Tax Paid | Tax Assessment Tax Assessment Total Assessment is a certain percentage of the fair market value that is determined by local assessors to be the total taxable value of land and additions on the property. | Land | Improvement |
|---|---|---|---|---|
| 2025 | $4,922 | $406,400 | $161,300 | $245,100 |
| 2024 | $4,768 | $396,700 | $161,300 | $235,400 |
| 2023 | $4,473 | $344,600 | $111,600 | $233,000 |
| 2022 | $4,177 | $299,000 | $101,500 | $197,500 |
| 2021 | $4,262 | $293,900 | $94,600 | $199,300 |
| 2020 | $4,156 | $274,300 | $82,800 | $191,500 |
| 2019 | $3,779 | $243,200 | $79,200 | $164,000 |
| 2018 | $3,559 | $221,600 | $79,200 | $142,400 |
| 2017 | $3,024 | $187,800 | $79,200 | $108,600 |
| 2016 | $3,309 | $190,600 | $75,500 | $115,100 |
| 2015 | $3,026 | $166,700 | $75,500 | $91,200 |
| 2014 | $3,129 | $172,600 | $75,500 | $97,100 |
Source: Public Records
Map
Nearby Homes
- 578 Plain St
- 1 Thomas Cir
- 23 Dondi Rd
- 118 Deanna Rd
- 31 Friendship Dr
- 16 Liberty St
- 18 American Ave
- 463 Pleasant St
- 16 Jason Way
- 15 Wachusetts Rd
- 12 Paulin Ave
- 9 Longworth Ave Unit 135
- 9 Longworth Ave Unit 113
- 15 Longworth Ave Unit 226
- 10 Colleen Way
- 25 Longworth Ave Unit 4
- 35 Longworth Ave Unit 25
- 323 Matfield St
- 549 Summer St
- 12 Finny's Way
Your Personal Tour Guide
Ask me questions while you tour the home.