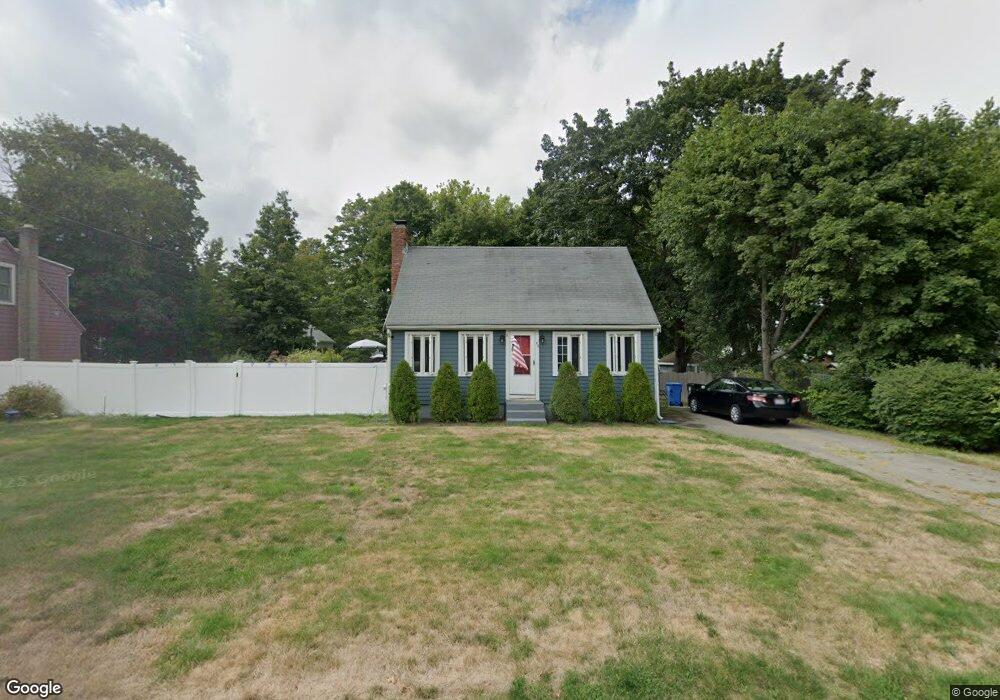
45 Kendrick St Whitman, MA 02382
Estimated Value: $449,000 - $494,000
2
Beds
1
Bath
1,008
Sq Ft
$465/Sq Ft
Est. Value
About This Home
This home is located at 45 Kendrick St, Whitman, MA 02382 and is currently estimated at $468,466, approximately $464 per square foot. 45 Kendrick St is a home located in Plymouth County with nearby schools including St Bridget School.
Ownership History
Date
Name
Owned For
Owner Type
Purchase Details
Closed on
Jun 30, 2008
Sold by
Option One Mortgage Co
Bought by
Umano Michelle and Cole Michael
Current Estimated Value
Purchase Details
Closed on
Jun 11, 2008
Sold by
Mcdonald Kevin J
Bought by
Us Bank Na Tr
Purchase Details
Closed on
May 3, 2006
Sold by
Showstead Richard A and Showstead Nancy M
Bought by
Mcdonald Kevin J
Purchase Details
Closed on
Nov 25, 1988
Sold by
Jarvinen Donald E
Bought by
Showstead Richard A
Home Financials for this Owner
Home Financials are based on the most recent Mortgage that was taken out on this home.
Original Mortgage
$141,400
Interest Rate
10.21%
Mortgage Type
Purchase Money Mortgage
Create a Home Valuation Report for This Property
The Home Valuation Report is an in-depth analysis detailing your home's value as well as a comparison with similar homes in the area
Home Values in the Area
Average Home Value in this Area
Purchase History
We collect this data history from publicly available records. To have your information removed, we recommend requesting removal directly through your county’s website.
| Date | Buyer | Sale Price | Title Company |
|---|---|---|---|
| Umano Michelle | $219,900 | -- | |
| Us Bank Na Tr | $246,500 | -- | |
| Mcdonald Kevin J | $291,000 | -- | |
| Showstead Richard A | $140,000 | -- |
Source: Public Records
Mortgage History
We collect this data history from publicly available records. To have your information removed, we recommend requesting removal directly through your county’s website.
| Date | Status | Borrower | Loan Amount |
|---|---|---|---|
| Previous Owner | Showstead Richard A | $141,350 | |
| Previous Owner | Showstead Richard A | $141,400 |
Source: Public Records
Tax History
| Year | Tax Paid | Tax Assessment Tax Assessment Total Assessment is a certain percentage of the fair market value that is determined by local assessors to be the total taxable value of land and additions on the property. | Land | Improvement |
|---|---|---|---|---|
| 2025 | $5,278 | $402,300 | $210,500 | $191,800 |
| 2024 | $4,915 | $385,800 | $206,500 | $179,300 |
| 2023 | $4,650 | $342,700 | $179,000 | $163,700 |
| 2022 | $4,585 | $314,900 | $162,700 | $152,200 |
| 2021 | $4,425 | $285,500 | $149,500 | $136,000 |
| 2020 | $4,324 | $272,800 | $142,400 | $130,400 |
| 2019 | $4,023 | $261,600 | $142,400 | $119,200 |
| 2018 | $3,894 | $243,200 | $134,300 | $108,900 |
| 2017 | $3,667 | $243,200 | $134,300 | $108,900 |
| 2016 | $3,514 | $225,400 | $127,100 | $98,300 |
| 2015 | $3,228 | $206,800 | $111,900 | $94,900 |
Source: Public Records
Map
Nearby Homes
- 214 Winter St
- 177 Pleasant St
- 55 Plymouth St Unit 15
- 147 South Ave
- 129 Commercial St
- 44 Morningside Dr
- 37 Lakeview St
- 659 Washington St
- 12 Driftwood Ln Unit 55
- 760 Washington St
- 56-58 Vernon St
- 724 Whitman St
- 456 Beulah St
- 24 Bowker Ave
- 17 Melvern Rd
- Plan B Northville Village Unit Plan B
- Unit 1 Northville Village Unit Plan A
- Unit 1 Northville Village
- 330 Spring St
- 330 Spring St Unit 1
Your Personal Tour Guide
Ask me questions while you tour the home.