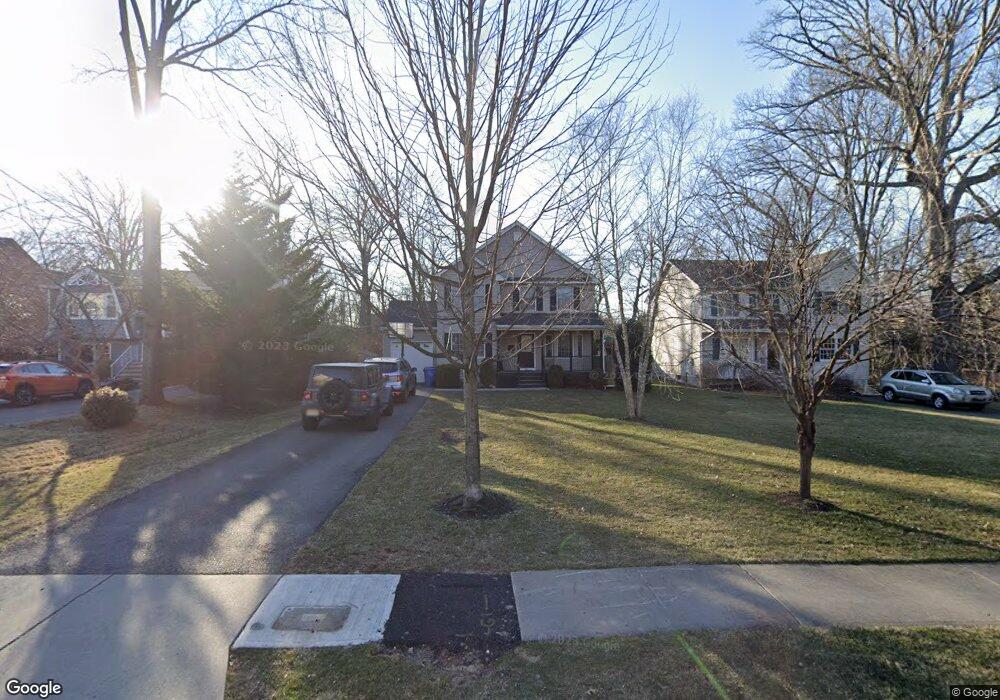
45 Kentnor St Metuchen, NJ 08840
Estimated Value: $1,024,007 - $1,098,000
4
Beds
3
Baths
2,200
Sq Ft
$480/Sq Ft
Est. Value
About This Home
This home is located at 45 Kentnor St, Metuchen, NJ 08840 and is currently estimated at $1,056,752, approximately $480 per square foot. 45 Kentnor St is a home located in Middlesex County with nearby schools including Edgar Middle School, Campbell Elementary School, and Metuchen High School.
Ownership History
Date
Name
Owned For
Owner Type
Purchase Details
Closed on
Jun 19, 2008
Sold by
Suburban Real Estate Development Corp
Bought by
Kuhne William J and Kuhne Ellen D
Current Estimated Value
Home Financials for this Owner
Home Financials are based on the most recent Mortgage that was taken out on this home.
Original Mortgage
$322,000
Outstanding Balance
$207,470
Interest Rate
6.13%
Mortgage Type
Purchase Money Mortgage
Estimated Equity
$849,282
Purchase Details
Closed on
Aug 1, 2007
Sold by
Morris Timothy and Morris Jacqueline
Bought by
Suburban Real Estate Developme
Create a Home Valuation Report for This Property
The Home Valuation Report is an in-depth analysis detailing your home's value as well as a comparison with similar homes in the area
Home Values in the Area
Average Home Value in this Area
Purchase History
| Date | Buyer | Sale Price | Title Company |
|---|---|---|---|
| Kuhne William J | $592,500 | None Available | |
| Suburban Real Estate Developme | -- | -- |
Source: Public Records
Mortgage History
| Date | Status | Borrower | Loan Amount |
|---|---|---|---|
| Open | Kuhne William J | $322,000 |
Source: Public Records
Tax History Compared to Growth
Tax History
| Year | Tax Paid | Tax Assessment Tax Assessment Total Assessment is a certain percentage of the fair market value that is determined by local assessors to be the total taxable value of land and additions on the property. | Land | Improvement |
|---|---|---|---|---|
| 2025 | $20,865 | $300,000 | $87,000 | $213,000 |
| 2024 | $20,166 | $300,000 | $87,000 | $213,000 |
| 2023 | $20,166 | $300,000 | $87,000 | $213,000 |
| 2022 | $19,113 | $300,000 | $87,000 | $213,000 |
| 2021 | $13,924 | $300,000 | $87,000 | $213,000 |
| 2020 | $16,156 | $263,000 | $87,000 | $176,000 |
| 2019 | $15,680 | $263,000 | $87,000 | $176,000 |
| 2018 | $15,622 | $263,000 | $87,000 | $176,000 |
| 2017 | $15,572 | $263,000 | $87,000 | $176,000 |
| 2016 | $15,175 | $263,000 | $87,000 | $176,000 |
| 2015 | $14,838 | $263,000 | $87,000 | $176,000 |
| 2014 | $14,413 | $262,000 | $86,900 | $175,100 |
Source: Public Records
Map
Nearby Homes