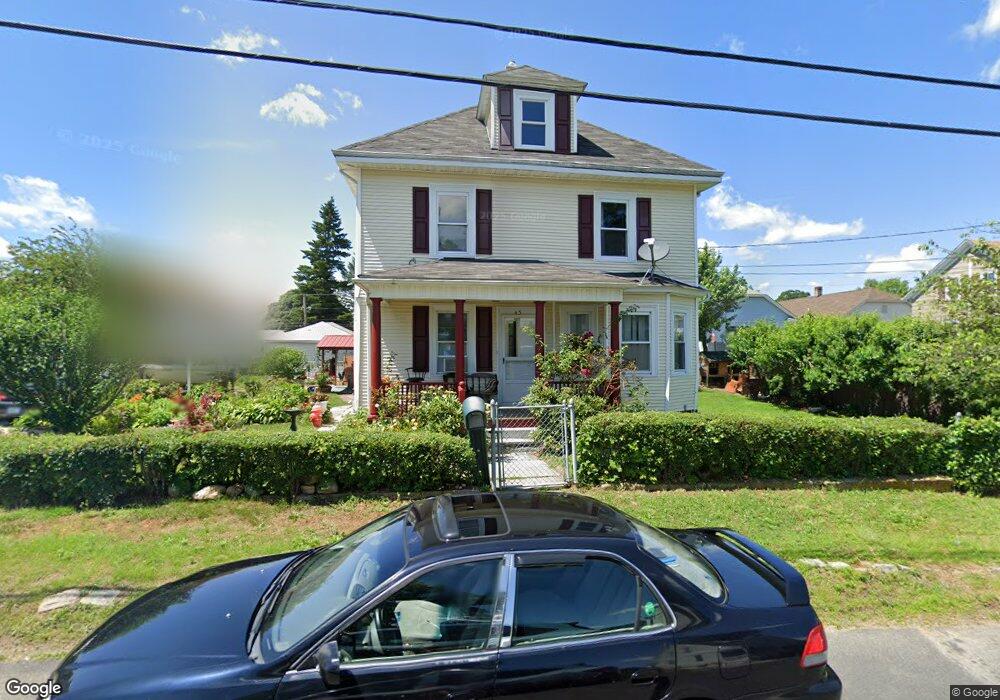
45 Leading St Johnston, RI 02919
Hartford Avenue NeighborhoodEstimated Value: $396,000 - $468,000
3
Beds
2
Baths
2,220
Sq Ft
$189/Sq Ft
Est. Value
About This Home
This home is located at 45 Leading St, Johnston, RI 02919 and is currently estimated at $419,633, approximately $189 per square foot. 45 Leading St is a home located in Providence County with nearby schools including Mazomanie Elementary School, Johnston Senior High School, and Mount Pleasant Academy.
Ownership History
Date
Name
Owned For
Owner Type
Purchase Details
Closed on
Mar 20, 2025
Sold by
Hernandez Brulio
Bought by
Hernandez Braulio and Motta Alba E
Current Estimated Value
Purchase Details
Closed on
Dec 5, 2005
Sold by
Robertson Re
Bought by
Hernandez Braulio
Home Financials for this Owner
Home Financials are based on the most recent Mortgage that was taken out on this home.
Original Mortgage
$177,600
Interest Rate
6.14%
Mortgage Type
Purchase Money Mortgage
Purchase Details
Closed on
Jul 26, 2000
Sold by
Ashley Realty Assoc
Bought by
Anderson Alvin T and Anderson Patricia
Create a Home Valuation Report for This Property
The Home Valuation Report is an in-depth analysis detailing your home's value as well as a comparison with similar homes in the area
Home Values in the Area
Average Home Value in this Area
Purchase History
| Date | Buyer | Sale Price | Title Company |
|---|---|---|---|
| Hernandez Braulio | -- | None Available | |
| Hernandez Braulio | -- | None Available | |
| Hernandez Braulio | $222,000 | -- | |
| Anderson Alvin T | $115,000 | -- | |
| Hernandez Braulio | $222,000 | -- | |
| Anderson Alvin T | $115,000 | -- |
Source: Public Records
Mortgage History
| Date | Status | Borrower | Loan Amount |
|---|---|---|---|
| Previous Owner | Anderson Alvin T | $25,300 | |
| Previous Owner | Anderson Alvin T | $177,600 |
Source: Public Records
Tax History Compared to Growth
Tax History
| Year | Tax Paid | Tax Assessment Tax Assessment Total Assessment is a certain percentage of the fair market value that is determined by local assessors to be the total taxable value of land and additions on the property. | Land | Improvement |
|---|---|---|---|---|
| 2025 | $4,534 | $290,300 | $84,800 | $205,500 |
| 2024 | $4,442 | $290,300 | $84,800 | $205,500 |
| 2023 | $4,442 | $290,300 | $84,800 | $205,500 |
| 2022 | $3,174 | $170,700 | $62,800 | $107,900 |
| 2021 | $3,967 | $170,700 | $62,800 | $107,900 |
| 2018 | $115 | $129,300 | $46,800 | $82,500 |
| 2016 | $4,703 | $129,300 | $46,800 | $82,500 |
| 2015 | $3,870 | $133,500 | $47,200 | $86,300 |
| 2014 | $3,838 | $133,500 | $47,200 | $86,300 |
| 2013 | $3,838 | $133,500 | $47,200 | $86,300 |
Source: Public Records
Map
Nearby Homes
- 71 Waveland St
- 46 Auburn Ave
- 2 Fairmount Ave
- 11 Traver Ave Unit 1
- 12 Oakland Ave
- 16 Homestead Ave
- 0 Woodbine St
- 0 Jackson Ave
- 50 Rosemont Ave
- 35 Hedley Ave
- 91 Clifton St
- 25 Devereux St Unit 205
- 6 Flanders St
- 11 Springfield Ave
- 44 Herschel St
- 17 Woonasquatucket Ave
- 19 S Long St
- 23 Columbus Ave
- 18 Lyman Ave
- 60 Rowley St