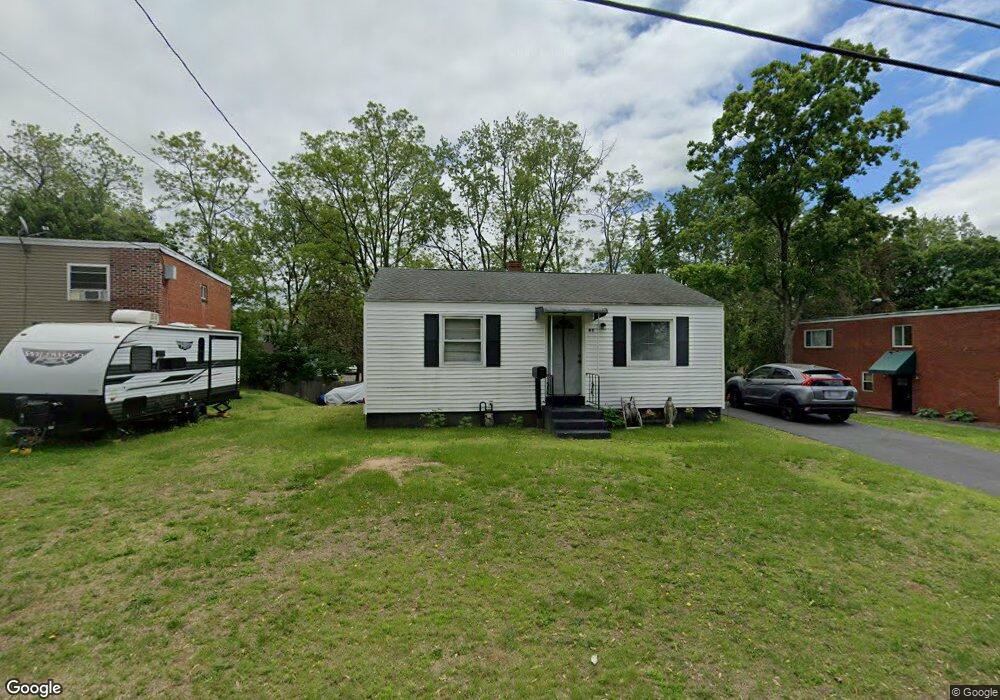
45 Leland Dr Springfield, MA 01109
Pine Point NeighborhoodEstimated Value: $180,000 - $240,000
2
Beds
1
Bath
720
Sq Ft
$296/Sq Ft
Est. Value
About This Home
This home is located at 45 Leland Dr, Springfield, MA 01109 and is currently estimated at $213,380, approximately $296 per square foot. 45 Leland Dr is a home located in Hampden County with nearby schools including Hiram L. Dorman Elementary, John F. Kennedy Academy, and Springfield Central High School.
Ownership History
Date
Name
Owned For
Owner Type
Purchase Details
Closed on
Aug 16, 2024
Sold by
Lecuyer John R
Bought by
Lecuyer John R and Lecuyer Babara J
Current Estimated Value
Purchase Details
Closed on
Jun 26, 2024
Sold by
Lecuyer Sr John R Est and Lecuyer
Bought by
Lecuyer John R
Purchase Details
Closed on
Sep 22, 1982
Bought by
Lecuyer John R and Lecuyer Lorraine F
Create a Home Valuation Report for This Property
The Home Valuation Report is an in-depth analysis detailing your home's value as well as a comparison with similar homes in the area
Home Values in the Area
Average Home Value in this Area
Purchase History
| Date | Buyer | Sale Price | Title Company |
|---|---|---|---|
| Lecuyer John R | -- | None Available | |
| Lecuyer John R | -- | None Available | |
| Lecuyer John R | -- | None Available | |
| Lecuyer John R | -- | None Available | |
| Lecuyer John R | $15,300 | -- |
Source: Public Records
Tax History
| Year | Tax Paid | Tax Assessment Tax Assessment Total Assessment is a certain percentage of the fair market value that is determined by local assessors to be the total taxable value of land and additions on the property. | Land | Improvement |
|---|---|---|---|---|
| 2025 | $1,891 | $120,600 | $39,100 | $81,500 |
| 2024 | $1,959 | $122,000 | $39,100 | $82,900 |
| 2023 | $2,000 | $117,300 | $34,600 | $82,700 |
| 2022 | $2,016 | $107,100 | $32,300 | $74,800 |
| 2021 | $1,848 | $97,800 | $29,400 | $68,400 |
| 2020 | $1,932 | $98,900 | $29,400 | $69,500 |
| 2019 | $1,533 | $77,900 | $30,400 | $47,500 |
| 2018 | $1,466 | $74,500 | $30,400 | $44,100 |
| 2017 | $1,590 | $80,900 | $33,500 | $47,400 |
| 2016 | $1,406 | $71,500 | $33,500 | $38,000 |
| 2015 | $1,456 | $74,000 | $33,500 | $40,500 |
Source: Public Records
Map
Nearby Homes
Your Personal Tour Guide
Ask me questions while you tour the home.