
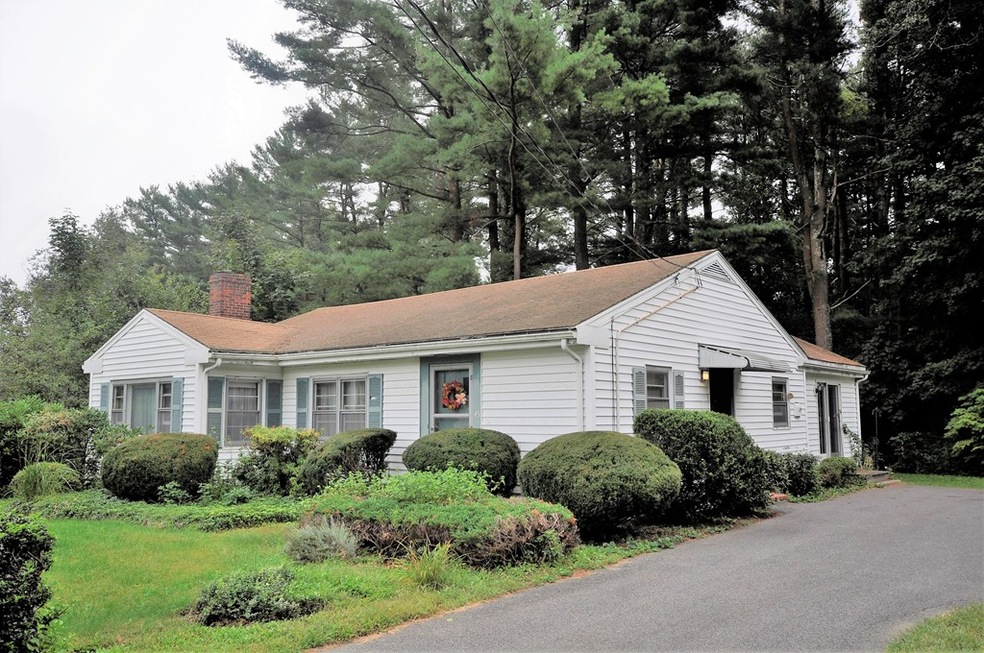
45 Leland St East Bridgewater, MA 02333
2
Beds
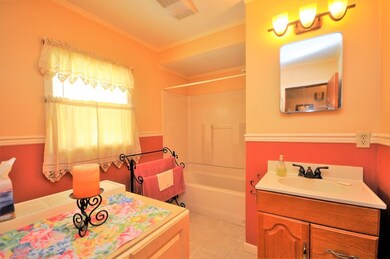
1
Bath
1,358
Sq Ft
0.39
Acres
About This Home
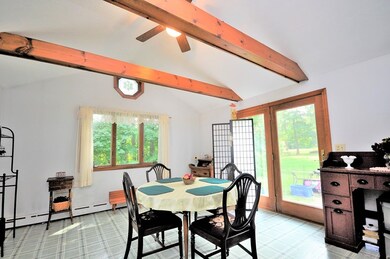
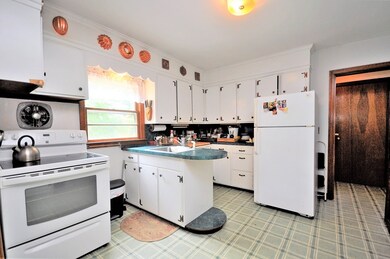
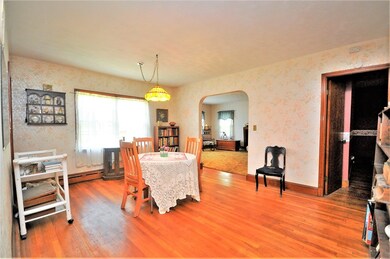
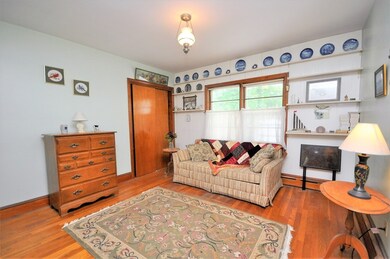
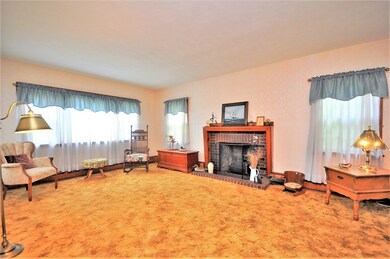
As of July 2025Affordable home in a lovely neighborhood with easy one floor living! Eat-In Kitchen, Beautiful Family Room with Beamed Ceiling and Slider, Hardwood Floors, Huge Living Room with Fireplace, and much more. Ready for your personal touches and updates!
Home Details
Home Type
- Single Family
Est. Annual Taxes
- $4,660
Year Built
- Built in 1955
Lot Details
- Property is zoned 100
Utilities
- Hot Water Baseboard Heater
- Heating System Uses Oil
- Private Sewer
Additional Features
- Basement
Listing and Financial Details
- Assessor Parcel Number M:64 P:44
Ownership History
Date
Name
Owned For
Owner Type
Purchase Details
Listed on
Jun 11, 2025
Closed on
Jul 16, 2025
Sold by
Lueck Nicholas K and Lueck Brittany A
Bought by
Quinn Nicholas and Conley Samantha M
Seller's Agent
Katelyn Fisher
Keller Williams Realty Colonial Partners
Buyer's Agent
Ryan Glass
Gibson Sotheby's International Realty
List Price
$525,000
Sold Price
$551,000
Premium/Discount to List
$26,000
4.95%
Views
35
Home Financials for this Owner
Home Financials are based on the most recent Mortgage that was taken out on this home.
Avg. Annual Appreciation
-44.30%
Original Mortgage
$468,350
Outstanding Balance
$468,350
Interest Rate
6.85%
Mortgage Type
New Conventional
Estimated Equity
$51,327
Purchase Details
Closed on
Sep 21, 2020
Sold by
Lueck Nicholas
Bought by
Lueck Nicholas K and Cleaves Brittany A
Home Financials for this Owner
Home Financials are based on the most recent Mortgage that was taken out on this home.
Original Mortgage
$275,500
Interest Rate
2.9%
Mortgage Type
New Conventional
Purchase Details
Listed on
Aug 17, 2018
Closed on
Nov 30, 2018
Sold by
Prosper Ann and Huffman Sally
Bought by
Lueck Nicholas
Seller's Agent
Kim West
Kim West Real Estate
Buyer's Agent
Jay Costantino
Conway - Hanover
List Price
$319,900
Sold Price
$285,000
Premium/Discount to List
-$34,900
-10.91%
Home Financials for this Owner
Home Financials are based on the most recent Mortgage that was taken out on this home.
Avg. Annual Appreciation
9.34%
Original Mortgage
$275,000
Interest Rate
4.8%
Mortgage Type
New Conventional
Purchase Details
Closed on
Oct 13, 2017
Sold by
Prosper Ann and Pomeroy Christine
Bought by
Prosper Ann and Pomeroy Christine
Similar Home in East Bridgewater, MA
Create a Home Valuation Report for This Property
The Home Valuation Report is an in-depth analysis detailing your home's value as well as a comparison with similar homes in the area
Home Values in the Area
Average Home Value in this Area
Purchase History
| Date | Type | Sale Price | Title Company |
|---|---|---|---|
| Deed | $551,000 | -- | |
| Quit Claim Deed | -- | None Available | |
| Quit Claim Deed | -- | None Available | |
| Not Resolvable | $285,000 | -- | |
| Quit Claim Deed | -- | -- | |
| Quit Claim Deed | -- | -- |
Source: Public Records
Mortgage History
| Date | Status | Loan Amount | Loan Type |
|---|---|---|---|
| Open | $468,350 | New Conventional | |
| Previous Owner | $50,000 | Stand Alone Refi Refinance Of Original Loan | |
| Previous Owner | $275,500 | New Conventional | |
| Previous Owner | $275,000 | New Conventional |
Source: Public Records
Property History
| Date | Event | Price | Change | Sq Ft Price |
|---|---|---|---|---|
| 07/16/2025 07/16/25 | Sold | $551,000 | +5.0% | $406 / Sq Ft |
| 06/15/2025 06/15/25 | Pending | -- | -- | -- |
| 06/11/2025 06/11/25 | For Sale | $525,000 | +84.2% | $387 / Sq Ft |
| 11/30/2018 11/30/18 | Sold | $285,000 | -5.0% | $210 / Sq Ft |
| 10/04/2018 10/04/18 | Pending | -- | -- | -- |
| 09/19/2018 09/19/18 | Price Changed | $299,900 | -6.3% | $221 / Sq Ft |
| 08/17/2018 08/17/18 | For Sale | $319,900 | -- | $236 / Sq Ft |
Source: MLS Property Information Network (MLS PIN)
Tax History Compared to Growth
Tax History
| Year | Tax Paid | Tax Assessment Tax Assessment Total Assessment is a certain percentage of the fair market value that is determined by local assessors to be the total taxable value of land and additions on the property. | Land | Improvement |
|---|---|---|---|---|
| 2025 | $4,660 | $340,900 | $171,600 | $169,300 |
| 2024 | $4,636 | $335,000 | $165,000 | $170,000 |
| 2023 | $4,686 | $324,300 | $165,000 | $159,300 |
| 2022 | $4,721 | $302,600 | $150,100 | $152,500 |
| 2021 | $4,702 | $275,800 | $144,200 | $131,600 |
| 2020 | $4,625 | $267,500 | $138,600 | $128,900 |
| 2019 | $4,566 | $260,000 | $132,500 | $127,500 |
| 2018 | $4,416 | $245,900 | $132,500 | $113,400 |
| 2017 | $4,326 | $236,400 | $126,400 | $110,000 |
| 2016 | $4,255 | $234,300 | $126,400 | $107,900 |
| 2015 | $4,170 | $234,800 | $125,500 | $109,300 |
| 2014 | $4,068 | $234,200 | $122,900 | $111,300 |
Source: Public Records
Agents Affiliated with this Home
-
Seller's Agent in 2025
Katelyn Fisher
Keller Williams Realty Colonial Partners
(781) 820-8932
1 in this area
28 Total Sales
-
Buyer's Agent in 2025
Ryan Glass
Gibson Sothebys International Realty
(617) 721-2143
1 in this area
156 Total Sales
-
Seller's Agent in 2018
Kim West
Kim West Real Estate
(508) 269-8303
65 in this area
111 Total Sales
-
J
Buyer's Agent in 2018
Jay Costantino
Conway - Hanover
1 in this area
29 Total Sales
Map
Source: MLS Property Information Network (MLS PIN)
MLS Number: 72380860
APN: EBRI-000064-000000-000044
Disclaimer: Certain information contained herein is derived from information provided by parties other than Homes.com. All information provided is deemed reliable, but is not guaranteed to be accurate and should be independently verified.
![]() The property listing data and information, or the Images, set forth herein were provided to MLS Property Information Network, Inc. from third party sources, including sellers, lessors and public records, and were compiled by MLS Property Information Network, Inc. The property listing data and information, and the Images, are for the personal, non-commercial use of consumers having a good faith interest in purchasing or leasing listed properties of the type displayed to them and may not be used for any purpose other than to identify prospective properties which such consumers may have a good faith interest in purchasing or leasing. MLS Property Information Network, Inc. and its subscribers disclaim any and all representations and warranties as to the accuracy of the property listing data and information, or as to the accuracy of any of the Images, set forth herein.
The property listing data and information, or the Images, set forth herein were provided to MLS Property Information Network, Inc. from third party sources, including sellers, lessors and public records, and were compiled by MLS Property Information Network, Inc. The property listing data and information, and the Images, are for the personal, non-commercial use of consumers having a good faith interest in purchasing or leasing listed properties of the type displayed to them and may not be used for any purpose other than to identify prospective properties which such consumers may have a good faith interest in purchasing or leasing. MLS Property Information Network, Inc. and its subscribers disclaim any and all representations and warranties as to the accuracy of the property listing data and information, or as to the accuracy of any of the Images, set forth herein.
Nearby Homes