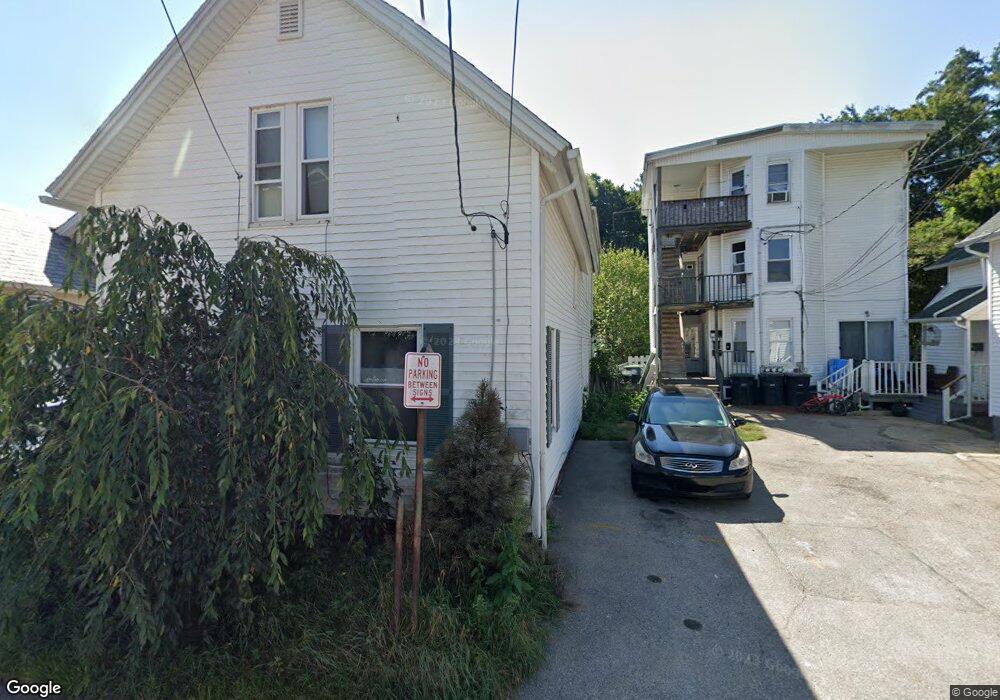
45 Lens St Unit 1 Southbridge, MA 01550
Estimated Value: $214,000 - $306,000
4
Beds
2
Baths
1,496
Sq Ft
$182/Sq Ft
Est. Value
About This Home
This home is located at 45 Lens St Unit 1, Southbridge, MA 01550 and is currently estimated at $272,392, approximately $182 per square foot. 45 Lens St Unit 1 is a home located in Worcester County with nearby schools including Trinity Catholic Academy and ViewPoint Christian Academy.
Ownership History
Date
Name
Owned For
Owner Type
Purchase Details
Closed on
Mar 31, 2022
Sold by
Rhonda Marie Colon T and Rhonda Henkel
Bought by
Le Thanh V
Current Estimated Value
Purchase Details
Closed on
Jul 11, 1997
Sold by
Tip Associates and Tsongalis
Bought by
Colon Rhonda M
Create a Home Valuation Report for This Property
The Home Valuation Report is an in-depth analysis detailing your home's value as well as a comparison with similar homes in the area
Home Values in the Area
Average Home Value in this Area
Purchase History
| Date | Buyer | Sale Price | Title Company |
|---|---|---|---|
| Le Thanh V | $118,000 | None Available | |
| Le Thanh V | $118,000 | None Available | |
| Colon Rhonda M | $39,500 | -- | |
| Colon Rhonda M | $39,500 | -- |
Source: Public Records
Mortgage History
| Date | Status | Borrower | Loan Amount |
|---|---|---|---|
| Previous Owner | Colon Rhonda M | $89,863 | |
| Previous Owner | Colon Rhonda M | $95,710 | |
| Previous Owner | Colon Rhonda M | $60,300 |
Source: Public Records
Tax History Compared to Growth
Tax History
| Year | Tax Paid | Tax Assessment Tax Assessment Total Assessment is a certain percentage of the fair market value that is determined by local assessors to be the total taxable value of land and additions on the property. | Land | Improvement |
|---|---|---|---|---|
| 2025 | $3,335 | $227,500 | $27,000 | $200,500 |
| 2024 | $3,079 | $201,800 | $13,500 | $188,300 |
| 2023 | $2,891 | $182,500 | $13,500 | $169,000 |
| 2022 | $2,721 | $152,000 | $11,500 | $140,500 |
| 2021 | $2,601 | $133,800 | $11,500 | $122,300 |
| 2020 | $2,340 | $120,100 | $11,500 | $108,600 |
| 2018 | $2,478 | $119,400 | $16,700 | $102,700 |
| 2017 | $2,197 | $106,800 | $16,700 | $90,100 |
| 2016 | $2,205 | $109,100 | $16,700 | $92,400 |
| 2015 | $2,109 | $103,600 | $18,000 | $85,600 |
| 2014 | $2,168 | $110,400 | $18,000 | $92,400 |
Source: Public Records
Map
Nearby Homes