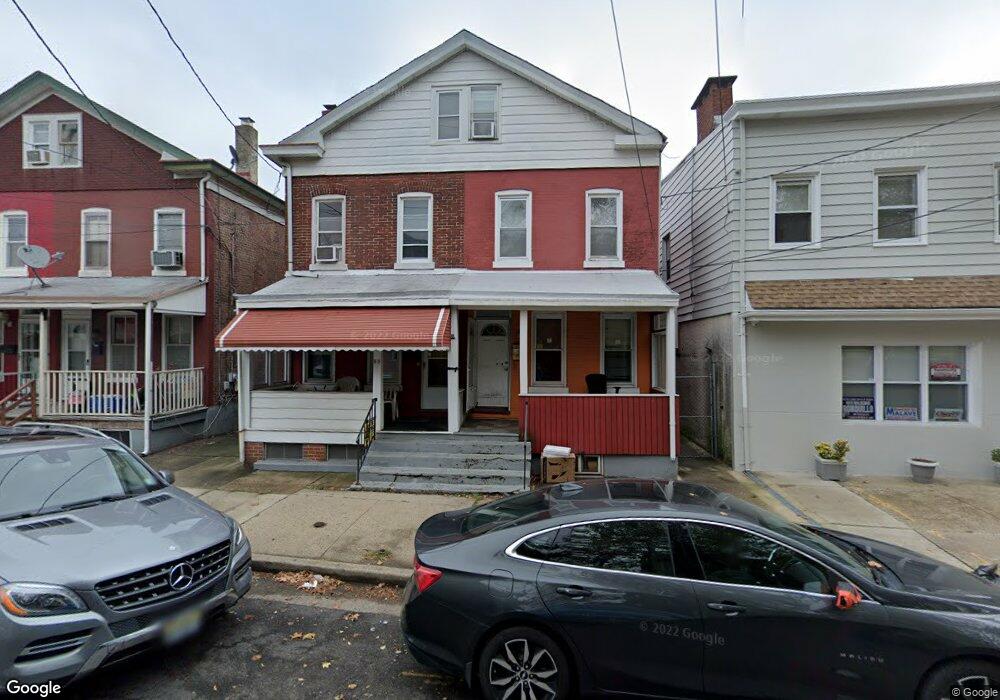
45 Liberty St Trenton, NJ 08611
Franklin Park NeighborhoodEstimated Value: $144,000 - $226,000
3
Beds
2
Baths
1,316
Sq Ft
$137/Sq Ft
Est. Value
About This Home
This home is located at 45 Liberty St, Trenton, NJ 08611 and is currently estimated at $180,005, approximately $136 per square foot. 45 Liberty St is a home located in Mercer County with nearby schools including Franklin Elementary School, Grace A Dunn Middle School, and Hedgepeth-Williams Elementary School.
Ownership History
Date
Name
Owned For
Owner Type
Purchase Details
Closed on
Feb 19, 2025
Sold by
Santiago Lorrene A and Felsheim Marianne
Bought by
45 Liberty Llc
Current Estimated Value
Purchase Details
Closed on
Jun 24, 1996
Sold by
Mccann Rose
Bought by
Santiago Henry
Home Financials for this Owner
Home Financials are based on the most recent Mortgage that was taken out on this home.
Original Mortgage
$53,000
Outstanding Balance
$3,402
Interest Rate
8.05%
Mortgage Type
FHA
Estimated Equity
$176,603
Create a Home Valuation Report for This Property
The Home Valuation Report is an in-depth analysis detailing your home's value as well as a comparison with similar homes in the area
Home Values in the Area
Average Home Value in this Area
Purchase History
| Date | Buyer | Sale Price | Title Company |
|---|---|---|---|
| 45 Liberty Llc | $145,000 | Dekel Abstract | |
| 45 Liberty Llc | $145,000 | Dekel Abstract | |
| Santiago Henry | $53,000 | -- |
Source: Public Records
Mortgage History
| Date | Status | Borrower | Loan Amount |
|---|---|---|---|
| Open | Santiago Henry | $53,000 |
Source: Public Records
Tax History Compared to Growth
Tax History
| Year | Tax Paid | Tax Assessment Tax Assessment Total Assessment is a certain percentage of the fair market value that is determined by local assessors to be the total taxable value of land and additions on the property. | Land | Improvement |
|---|---|---|---|---|
| 2025 | $3,724 | $64,200 | $7,200 | $57,000 |
| 2024 | $3,574 | $64,200 | $7,200 | $57,000 |
| 2023 | $3,574 | $64,200 | $7,200 | $57,000 |
| 2022 | $3,504 | $64,200 | $7,200 | $57,000 |
| 2021 | $3,565 | $64,200 | $7,200 | $57,000 |
| 2020 | $3,553 | $64,200 | $7,200 | $57,000 |
| 2019 | $3,496 | $64,200 | $7,200 | $57,000 |
| 2018 | $3,347 | $64,200 | $7,200 | $57,000 |
| 2017 | $3,181 | $64,200 | $7,200 | $57,000 |
| 2016 | $3,768 | $65,500 | $15,300 | $50,200 |
| 2015 | $3,755 | $65,500 | $15,300 | $50,200 |
| 2014 | $3,737 | $65,500 | $15,300 | $50,200 |
Source: Public Records
Map
Nearby Homes