
Landlord's Agent in 2022
Jack Brown
RE/MAX
(508) 284-5098
3 in this area
157 Total Sales
Estimated Value: $288,073 - $329,000
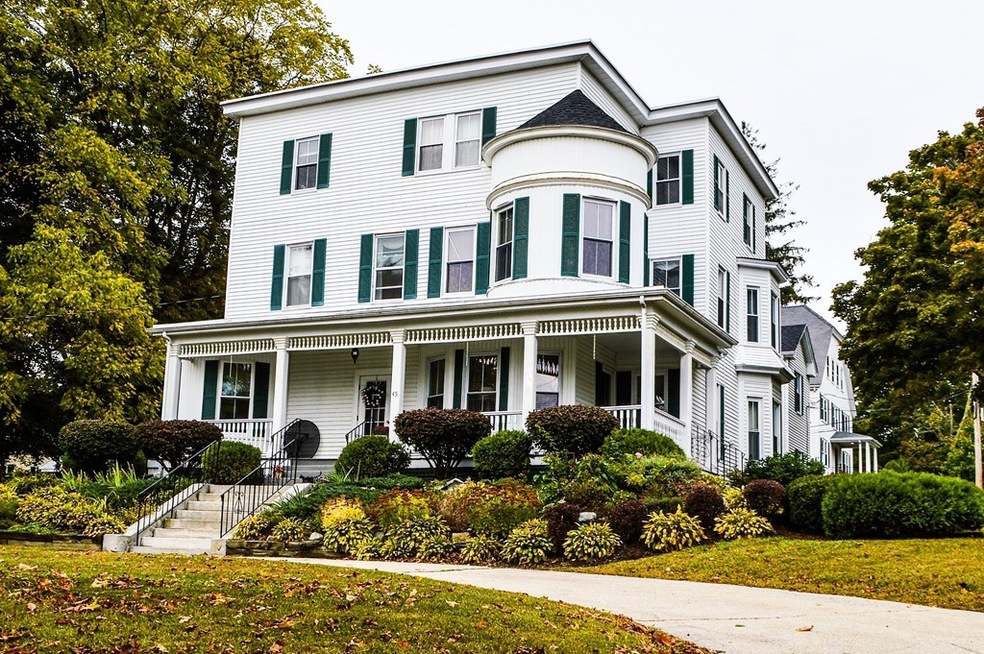
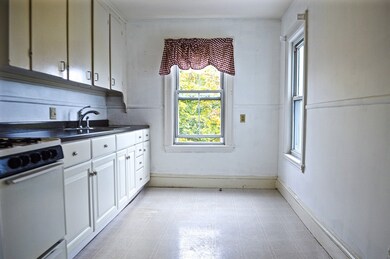
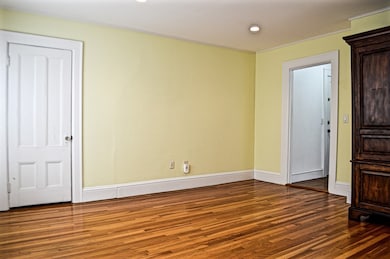
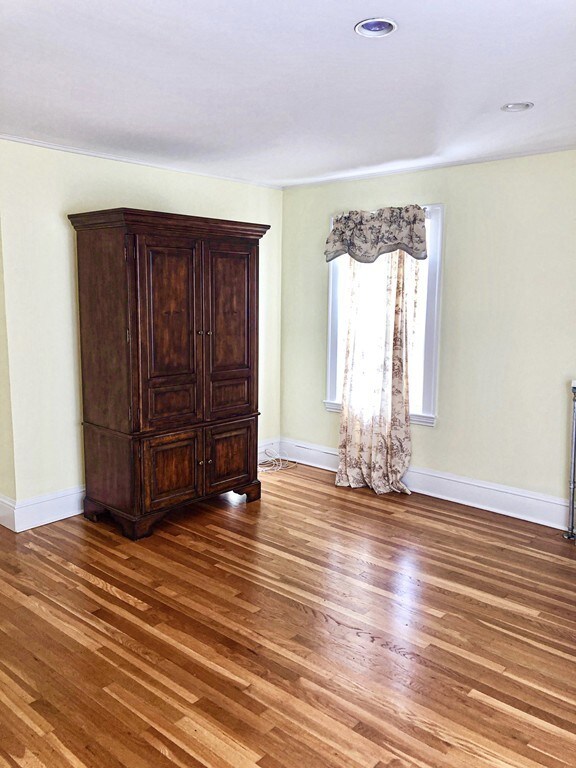
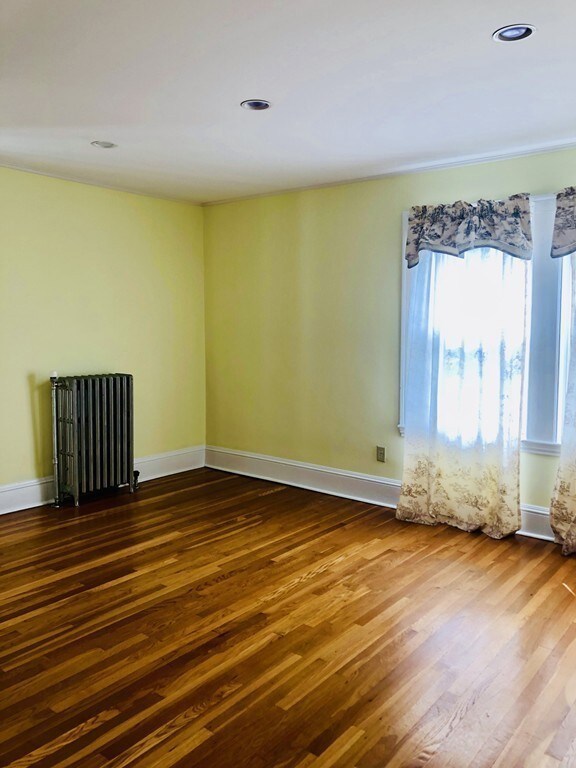
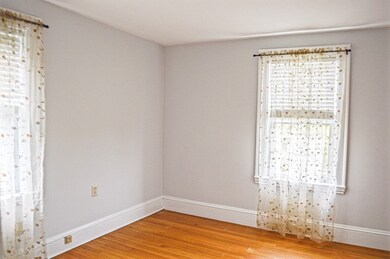
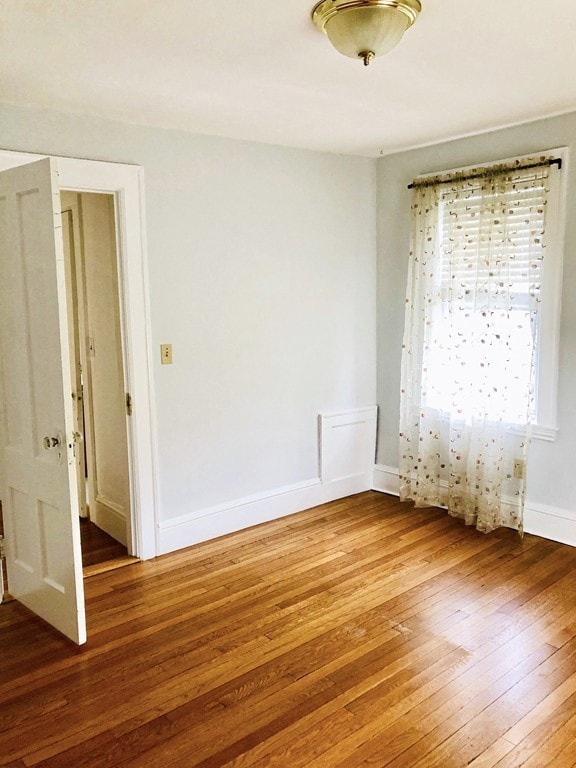
HEAT, HOT WATER, AND ELECTRICITY INCLUDED IN RENT! Enjoy living in this quiet neighborhood close to downtown Danvers. This lovely and light 1 bedroom apartment in a beautiful well-maintained building has a large living room, eat-in kitchen, hardwood floors throughout, high ceilings, and extra storage on the same floor as the apartment. Comes with 2 off-street parking spots and laundry in the basement. Pets: One cat only allowed--no dogs. Showings will be at OH on Wednesday, June 22, 2022 from 6-7:30 and Saturday, June 25, 2022 from 11am-12pm. Please call for an appointment.
| Date | Buyer | Sale Price | Title Company |
|---|---|---|---|
| Rocco Anthony T | -- | -- |
| Date | Event | Price | List to Sale | Price per Sq Ft |
|---|---|---|---|---|
| 06/29/2022 06/29/22 | Rented | $1,475 | 0.0% | -- |
| 06/27/2022 06/27/22 | Under Contract | -- | -- | -- |
| 06/20/2022 06/20/22 | For Rent | $1,475 | 0.0% | -- |
| 03/01/2021 03/01/21 | Rented | $1,475 | 0.0% | -- |
| 02/26/2021 02/26/21 | Under Contract | -- | -- | -- |
| 02/15/2021 02/15/21 | For Rent | $1,475 | +5.4% | -- |
| 10/19/2019 10/19/19 | Rented | $1,400 | 0.0% | -- |
| 10/16/2019 10/16/19 | Under Contract | -- | -- | -- |
| 10/08/2019 10/08/19 | For Rent | $1,400 | +16.7% | -- |
| 07/07/2013 07/07/13 | Rented | $1,200 | 0.0% | -- |
| 07/07/2013 07/07/13 | For Rent | $1,200 | 0.0% | -- |
| 03/05/2013 03/05/13 | Rented | $1,200 | 0.0% | -- |
| 02/03/2013 02/03/13 | Under Contract | -- | -- | -- |
| 12/10/2012 12/10/12 | For Rent | $1,200 | -- | -- |
| Year | Tax Paid | Tax Assessment Tax Assessment Total Assessment is a certain percentage of the fair market value that is determined by local assessors to be the total taxable value of land and additions on the property. | Land | Improvement |
|---|---|---|---|---|
| 2025 | $2,971 | $270,300 | $0 | $270,300 |
| 2024 | $2,861 | $257,500 | $0 | $257,500 |
| 2023 | $2,820 | $240,000 | $0 | $240,000 |
| 2022 | $2,719 | $214,800 | $0 | $214,800 |
| 2021 | $2,689 | $201,400 | $0 | $201,400 |
| 2020 | $2,457 | $188,100 | $0 | $188,100 |
| 2019 | $2,398 | $180,600 | $0 | $180,600 |
| 2018 | $2,333 | $172,300 | $0 | $172,300 |
| 2017 | $2,445 | $172,300 | $0 | $172,300 |
| 2016 | $1,978 | $139,300 | $0 | $139,300 |
| 2015 | $2,004 | $134,400 | $0 | $134,400 |
Landlord's Agent in 2022
Jack Brown
RE/MAX
(508) 284-5098
3 in this area
157 Total Sales
Seller's Agent in 2013
Annette Gregorio
Leading Edge Real Estate
(617) 548-3180
42 Total Sales
J
Seller's Agent in 2013
Joan Mason
Coldwell Banker Realty - Beverly
(978) 204-1996
1 Total Sale
Buyer's Agent in 2013
Heather Murray
RE/MAX
(617) 967-8231
7 Total Sales
Source: MLS Property Information Network (MLS PIN)
MLS Number: 73000425
APN: DANV-000035-000000-000098-L000008-L000008
Disclaimer: Certain information contained herein is derived from information provided by parties other than Homes.com. All information provided is deemed reliable, but is not guaranteed to be accurate and should be independently verified.
![]() The property listing data and information, or the Images, set forth herein were provided to MLS Property Information Network, Inc. from third party sources, including sellers, lessors and public records, and were compiled by MLS Property Information Network, Inc. The property listing data and information, and the Images, are for the personal, non-commercial use of consumers having a good faith interest in purchasing or leasing listed properties of the type displayed to them and may not be used for any purpose other than to identify prospective properties which such consumers may have a good faith interest in purchasing or leasing. MLS Property Information Network, Inc. and its subscribers disclaim any and all representations and warranties as to the accuracy of the property listing data and information, or as to the accuracy of any of the Images, set forth herein.
The property listing data and information, or the Images, set forth herein were provided to MLS Property Information Network, Inc. from third party sources, including sellers, lessors and public records, and were compiled by MLS Property Information Network, Inc. The property listing data and information, and the Images, are for the personal, non-commercial use of consumers having a good faith interest in purchasing or leasing listed properties of the type displayed to them and may not be used for any purpose other than to identify prospective properties which such consumers may have a good faith interest in purchasing or leasing. MLS Property Information Network, Inc. and its subscribers disclaim any and all representations and warranties as to the accuracy of the property listing data and information, or as to the accuracy of any of the Images, set forth herein.
Ask me questions while you tour the home.