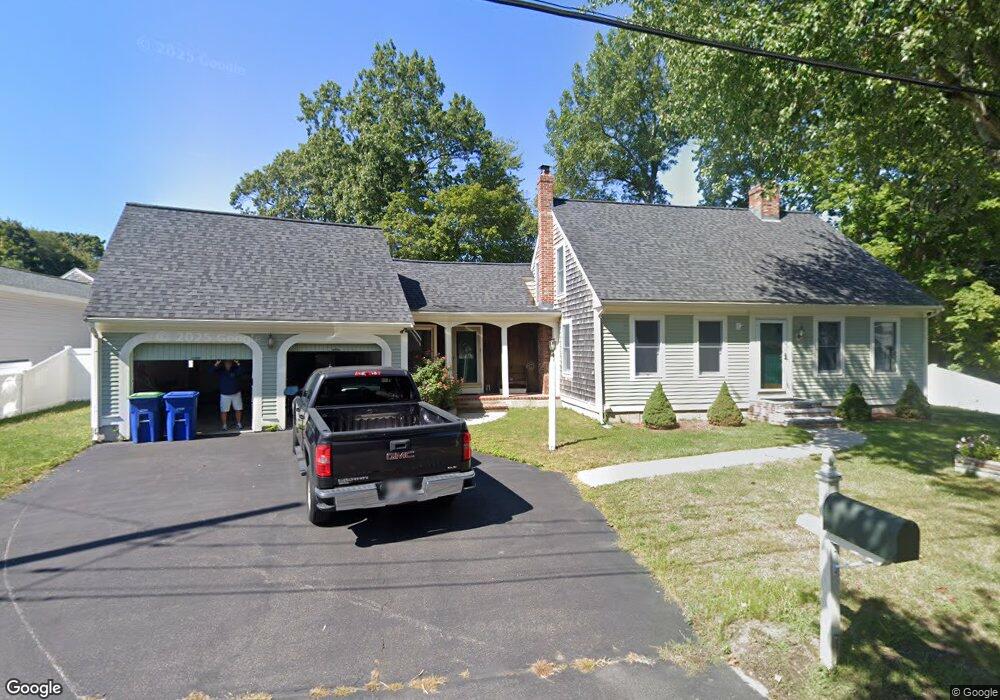
45 Logan Rd Braintree, MA 02184
South Braintree NeighborhoodEstimated Value: $788,000 - $932,000
3
Beds
2
Baths
1,784
Sq Ft
$477/Sq Ft
Est. Value
About This Home
This home is located at 45 Logan Rd, Braintree, MA 02184 and is currently estimated at $850,621, approximately $476 per square foot. 45 Logan Rd is a home located in Norfolk County with nearby schools including Braintree High School, Step Ahead Kindergarten, and Thayer Academy.
Ownership History
Date
Name
Owned For
Owner Type
Purchase Details
Closed on
May 30, 1997
Sold by
Graham Paul J and Graham Kathryn
Bought by
Preston Jeffrey D and Preston Sarah A
Current Estimated Value
Create a Home Valuation Report for This Property
The Home Valuation Report is an in-depth analysis detailing your home's value as well as a comparison with similar homes in the area
Home Values in the Area
Average Home Value in this Area
Purchase History
| Date | Buyer | Sale Price | Title Company |
|---|---|---|---|
| Preston Jeffrey D | $250,000 | -- | |
| Preston Jeffrey D | $250,000 | -- |
Source: Public Records
Mortgage History
| Date | Status | Borrower | Loan Amount |
|---|---|---|---|
| Open | Preston Jeffrey D | $230,000 | |
| Closed | Preston Jeffrey D | $275,000 |
Source: Public Records
Tax History
| Year | Tax Paid | Tax Assessment Tax Assessment Total Assessment is a certain percentage of the fair market value that is determined by local assessors to be the total taxable value of land and additions on the property. | Land | Improvement |
|---|---|---|---|---|
| 2025 | $7,556 | $757,100 | $340,300 | $416,800 |
| 2024 | $6,937 | $731,700 | $317,300 | $414,400 |
| 2023 | $6,614 | $677,700 | $285,100 | $392,600 |
| 2022 | $6,468 | $650,100 | $257,500 | $392,600 |
| 2021 | $5,898 | $592,800 | $232,700 | $360,100 |
| 2020 | $5,636 | $571,600 | $211,500 | $360,100 |
| 2019 | $5,457 | $540,800 | $202,300 | $338,500 |
| 2018 | $5,367 | $509,200 | $183,900 | $325,300 |
| 2017 | $5,228 | $486,800 | $174,700 | $312,100 |
| 2016 | $4,945 | $450,400 | $147,100 | $303,300 |
| 2015 | $4,844 | $437,600 | $145,300 | $292,300 |
| 2014 | $4,637 | $406,000 | $132,400 | $273,600 |
Source: Public Records
Map
Nearby Homes
- 29 Saint Michael Rd
- 6 Lunar Ave
- 18 Royal Lake Dr Unit 3
- 80 Lake St
- 145 Hancock St Unit 307
- 145 Hancock St Unit 309
- 145 Hancock St Unit 201
- 6 Franklin St
- 614 Pond St Unit 2104
- 1579 Washington St
- 418 John Mahar Hwy Unit 408
- 422 John Mahar Hwy Unit 408
- 15 Alida Rd
- 4 Powdrell Ave
- 426 John Mahar Hwy Unit 311
- 5 Woodsum Dr Unit 12
- 7 Del's Way
- 6 Oak St
- 700 North St
- 47 Addison St
Your Personal Tour Guide
Ask me questions while you tour the home.