45 Low St Newbury, MA 01951
Estimated Value: $882,220 - $1,124,000
4
Beds
3
Baths
2,325
Sq Ft
$410/Sq Ft
Est. Value
About This Home
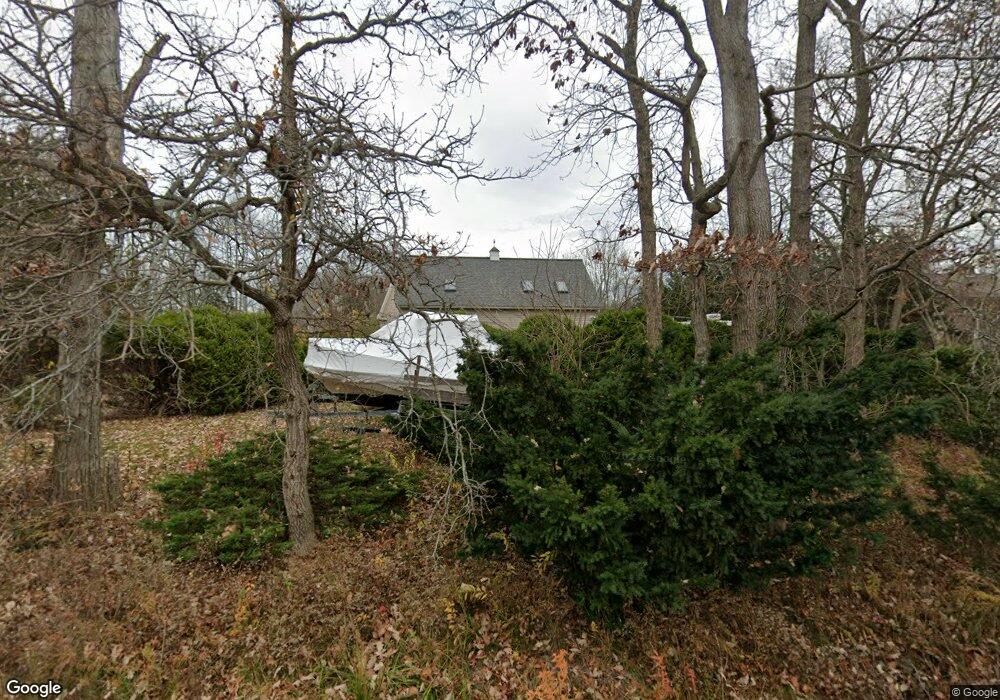
This home is located at 45 Low St, Newbury, MA 01951 and is currently estimated at $954,305, approximately $410 per square foot. 45 Low St is a home located in Essex County with nearby schools including Triton Regional High School, River Valley Charter School, and Immaculate Conception School.
Ownership History
Date
Name
Owned For
Owner Type
Purchase Details
Closed on
Dec 21, 2020
Sold by
Lebsack Eugenia N and Lebsack Neal R
Bought by
Triglione Spencer
Current Estimated Value
Home Financials for this Owner
Home Financials are based on the most recent Mortgage that was taken out on this home.
Original Mortgage
$428,000
Outstanding Balance
$378,243
Interest Rate
2.8%
Mortgage Type
New Conventional
Estimated Equity
$576,062
Purchase Details
Closed on
Nov 23, 1994
Sold by
Brown David M and Brown Carolyn A
Bought by
Lebsack Neal R and Lebsack Eugenia Neal
Create a Home Valuation Report for This Property
The Home Valuation Report is an in-depth analysis detailing your home's value as well as a comparison with similar homes in the area
Home Values in the Area
Average Home Value in this Area
Purchase History
| Date | Buyer | Sale Price | Title Company |
|---|---|---|---|
| Triglione Spencer | $535,000 | None Available | |
| Triglione Spencer | $535,000 | None Available | |
| Triglione Spencer | $535,000 | None Available | |
| Triglione Spencer | $535,000 | None Available | |
| Lebsack Neal R | $243,000 | -- | |
| Lebsack Neal R | $243,000 | -- |
Source: Public Records
Mortgage History
| Date | Status | Borrower | Loan Amount |
|---|---|---|---|
| Open | Triglione Spencer | $428,000 | |
| Closed | Triglione Spencer | $428,000 | |
| Previous Owner | Lebsack Neal R | $235,000 |
Source: Public Records
Tax History
| Year | Tax Paid | Tax Assessment Tax Assessment Total Assessment is a certain percentage of the fair market value that is determined by local assessors to be the total taxable value of land and additions on the property. | Land | Improvement |
|---|---|---|---|---|
| 2025 | $6,013 | $807,100 | $336,300 | $470,800 |
| 2024 | $5,917 | $770,500 | $336,300 | $434,200 |
| 2023 | $5,974 | $689,000 | $314,500 | $374,500 |
| 2022 | $5,861 | $602,400 | $271,000 | $331,400 |
| 2021 | $5,766 | $540,900 | $227,400 | $313,500 |
| 2020 | $5,821 | $529,700 | $227,400 | $302,300 |
| 2019 | $5,726 | $529,700 | $227,400 | $302,300 |
| 2018 | $5,508 | $505,300 | $220,900 | $284,400 |
| 2017 | $5,267 | $496,400 | $220,900 | $275,500 |
| 2016 | $5,347 | $469,000 | $205,600 | $263,400 |
| 2015 | $4,902 | $425,500 | $162,100 | $263,400 |
| 2014 | $4,693 | $414,600 | $151,200 | $263,400 |
Source: Public Records
Map
Nearby Homes
- 4 Knights Ct
- 83 High Rd
- 4 Gadsden Ln
- 1 Littles Ln
- 11 Maple Terrace
- 6 S Pond St
- 54 Cottage Rd
- 26 Beacon Ave
- 4 Goodwin Ave
- 28 & 30 Plum Island Turnpike
- 10 Old Rowley Rd
- 51 High St
- 95 Lime St Unit 1-6
- 58 Lime St Unit 5
- 1 Salem St Unit 2
- 95 High St Unit 4
- 95 High St Unit 1
- 52 Fair St Unit 2D
- 105 State St Unit 101
- 105 State St Unit 301
Your Personal Tour Guide
Ask me questions while you tour the home.