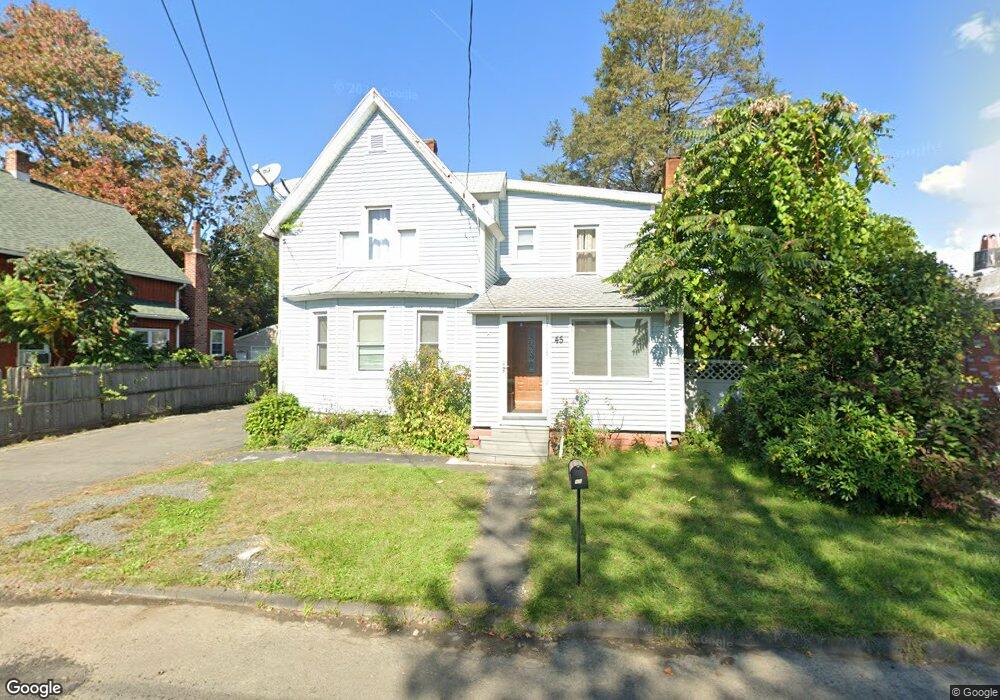
45 Lowell St West Springfield, MA 01089
Estimated Value: $267,000 - $309,000
3
Beds
2
Baths
1,596
Sq Ft
$184/Sq Ft
Est. Value
About This Home
This home is located at 45 Lowell St, West Springfield, MA 01089 and is currently estimated at $294,447, approximately $184 per square foot. 45 Lowell St is a home located in Hampden County with nearby schools including West Springfield High School, Hampden Charter School of Science West, and Libertas Academy Charter School.
Ownership History
Date
Name
Owned For
Owner Type
Purchase Details
Closed on
May 29, 2008
Sold by
Deutsche Bank Natl T C
Bought by
Munteanu Gheorghe
Current Estimated Value
Home Financials for this Owner
Home Financials are based on the most recent Mortgage that was taken out on this home.
Original Mortgage
$80,000
Outstanding Balance
$50,967
Interest Rate
5.91%
Mortgage Type
Purchase Money Mortgage
Estimated Equity
$243,480
Purchase Details
Closed on
Mar 27, 2008
Sold by
Masic Fatima
Bought by
Deutsche Bank Natl T C
Purchase Details
Closed on
Jun 21, 2001
Sold by
Christian Charles M and Christian Selina
Bought by
Masic Fatima and Masic Nedzad
Home Financials for this Owner
Home Financials are based on the most recent Mortgage that was taken out on this home.
Original Mortgage
$86,317
Interest Rate
7.09%
Mortgage Type
Purchase Money Mortgage
Create a Home Valuation Report for This Property
The Home Valuation Report is an in-depth analysis detailing your home's value as well as a comparison with similar homes in the area
Home Values in the Area
Average Home Value in this Area
Purchase History
| Date | Buyer | Sale Price | Title Company |
|---|---|---|---|
| Munteanu Gheorghe | $120,000 | -- | |
| Deutsche Bank Natl T C | $105,622 | -- | |
| Masic Fatima | $87,000 | -- |
Source: Public Records
Mortgage History
| Date | Status | Borrower | Loan Amount |
|---|---|---|---|
| Open | Munteanu Gheorghe | $80,000 | |
| Previous Owner | Masic Fatima | $86,317 | |
| Previous Owner | Masic Fatima | $87,800 | |
| Previous Owner | Masic Fatima | $59,500 |
Source: Public Records
Tax History Compared to Growth
Tax History
| Year | Tax Paid | Tax Assessment Tax Assessment Total Assessment is a certain percentage of the fair market value that is determined by local assessors to be the total taxable value of land and additions on the property. | Land | Improvement |
|---|---|---|---|---|
| 2025 | $3,661 | $246,200 | $85,500 | $160,700 |
| 2024 | $3,437 | $232,100 | $85,500 | $146,600 |
| 2023 | $3,251 | $209,200 | $85,500 | $123,700 |
| 2022 | $2,930 | $185,900 | $77,600 | $108,300 |
| 2021 | $2,694 | $159,400 | $62,200 | $97,200 |
| 2020 | $2,705 | $159,200 | $62,200 | $97,000 |
| 2019 | $2,700 | $159,200 | $62,200 | $97,000 |
| 2018 | $2,714 | $159,200 | $62,200 | $97,000 |
| 2017 | $2,714 | $159,200 | $62,200 | $97,000 |
| 2016 | $2,664 | $156,800 | $59,800 | $97,000 |
| 2015 | $2,581 | $151,900 | $58,600 | $93,300 |
| 2014 | $625 | $151,900 | $58,600 | $93,300 |
Source: Public Records
Map
Nearby Homes
- 56 Exposition Terrace
- 37 Day St
- 44 Spring St
- 220 New Bridge St
- 30 Day St
- 369 Cold Spring Ave
- 31 Russell St
- 32 Colony Rd Unit 1
- 31 Colony Rd
- 1010 Main St
- 27 Park Avenue Ct Unit 8
- 95 Park Ave Unit 1
- Lot 10 Ahiska Rd
- 51 Reed St
- 67 Suffield St
- 121 Reed St
- 44 Spring St
- 278 Elm St
- 21 High St
- 138 Suffield St