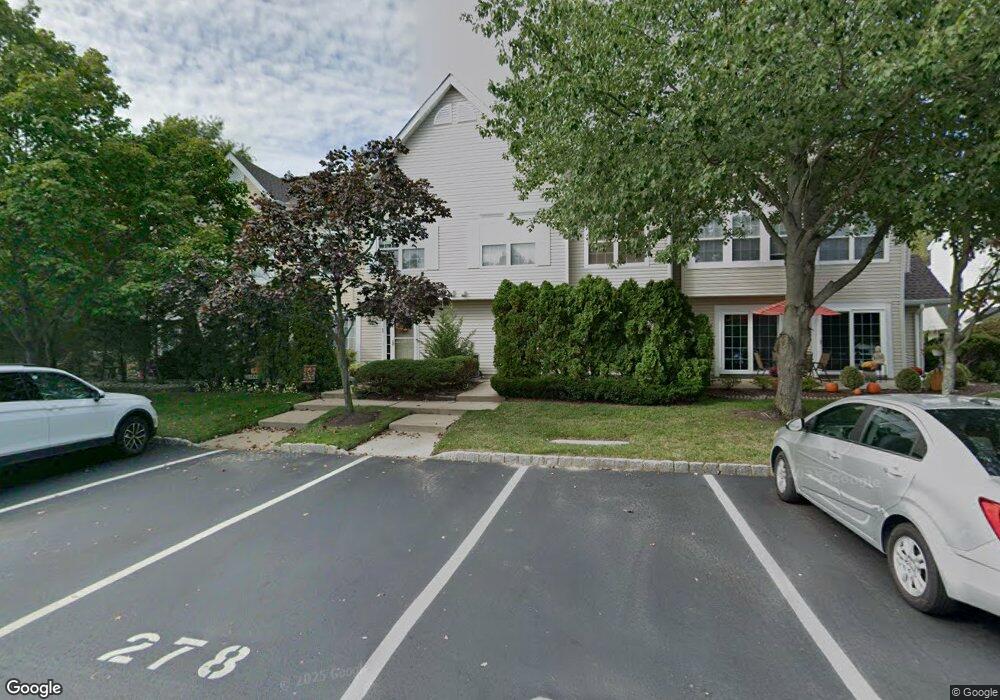
45 Madison Ct Tinton Falls, NJ 07712
Estimated Value: $462,000 - $484,177
2
Beds
1
Bath
1,652
Sq Ft
$286/Sq Ft
Est. Value
About This Home
This home is located at 45 Madison Ct, Tinton Falls, NJ 07712 and is currently estimated at $473,044, approximately $286 per square foot. 45 Madison Ct is a home located in Monmouth County with nearby schools including Mahala F. Atchinson Elementary School, Swimming River Elementary School, and Tinton Falls Middle School.
Ownership History
Date
Name
Owned For
Owner Type
Purchase Details
Closed on
Mar 18, 2002
Sold by
Sherlock Steve
Bought by
Fleetwood James
Current Estimated Value
Home Financials for this Owner
Home Financials are based on the most recent Mortgage that was taken out on this home.
Original Mortgage
$181,000
Interest Rate
6.82%
Purchase Details
Closed on
Nov 21, 2000
Sold by
Ragenklint Carl
Bought by
Sherlock Steve
Home Financials for this Owner
Home Financials are based on the most recent Mortgage that was taken out on this home.
Original Mortgage
$188,387
Interest Rate
7.76%
Mortgage Type
VA
Purchase Details
Closed on
Aug 1, 1997
Sold by
Hovbilt Inc
Bought by
Ragenklint Carl and Ragenklint Michele
Home Financials for this Owner
Home Financials are based on the most recent Mortgage that was taken out on this home.
Original Mortgage
$99,000
Interest Rate
7.55%
Create a Home Valuation Report for This Property
The Home Valuation Report is an in-depth analysis detailing your home's value as well as a comparison with similar homes in the area
Home Values in the Area
Average Home Value in this Area
Purchase History
| Date | Buyer | Sale Price | Title Company |
|---|---|---|---|
| Fleetwood James | $196,000 | -- | |
| Sherlock Steve | $182,900 | -- | |
| Ragenklint Carl | $123,662 | -- |
Source: Public Records
Mortgage History
| Date | Status | Borrower | Loan Amount |
|---|---|---|---|
| Previous Owner | Fleetwood James | $181,000 | |
| Previous Owner | Sherlock Steve | $188,387 | |
| Previous Owner | Ragenklint Carl | $99,000 |
Source: Public Records
Tax History Compared to Growth
Tax History
| Year | Tax Paid | Tax Assessment Tax Assessment Total Assessment is a certain percentage of the fair market value that is determined by local assessors to be the total taxable value of land and additions on the property. | Land | Improvement |
|---|---|---|---|---|
| 2025 | $5,956 | $433,800 | $222,200 | $211,600 |
| 2024 | $6,263 | $413,900 | $207,200 | $206,700 |
| 2023 | $6,263 | $410,400 | $190,000 | $220,400 |
| 2022 | $5,250 | $319,800 | $110,000 | $209,800 |
| 2021 | $5,235 | $272,600 | $105,000 | $167,600 |
| 2020 | $5,363 | $268,800 | $105,000 | $163,800 |
| 2019 | $5,235 | $262,800 | $100,000 | $162,800 |
| 2018 | $5,101 | $255,300 | $100,000 | $155,300 |
| 2017 | $5,069 | $247,400 | $95,000 | $152,400 |
| 2016 | $5,039 | $240,400 | $90,000 | $150,400 |
| 2015 | $4,860 | $234,800 | $90,000 | $144,800 |
| 2014 | $4,938 | $228,200 | $70,000 | $158,200 |
Source: Public Records
Map
Nearby Homes
- 43 Madison Ct
- 47 Madison Ct Unit 25
- 46 Madison Ct
- 48 Madison Ct
- 44 Madison Ct Unit 30
- 41 Madison Ct Unit 31
- 42 Madison Ct
- 39 Madison Ct
- 40 Madison Ct
- 37 Madison Ct
- 50 Madison Ct Unit 40
- 49 Madison Ct
- 38 Madison Ct
- 35 Madison Ct Unit 21
- 52 Madison Ct
- 36 Madison Ct
- 51 Madison Ct
- 54 Madison Ct
- 33 Madison Ct
- 53 Madison Ct