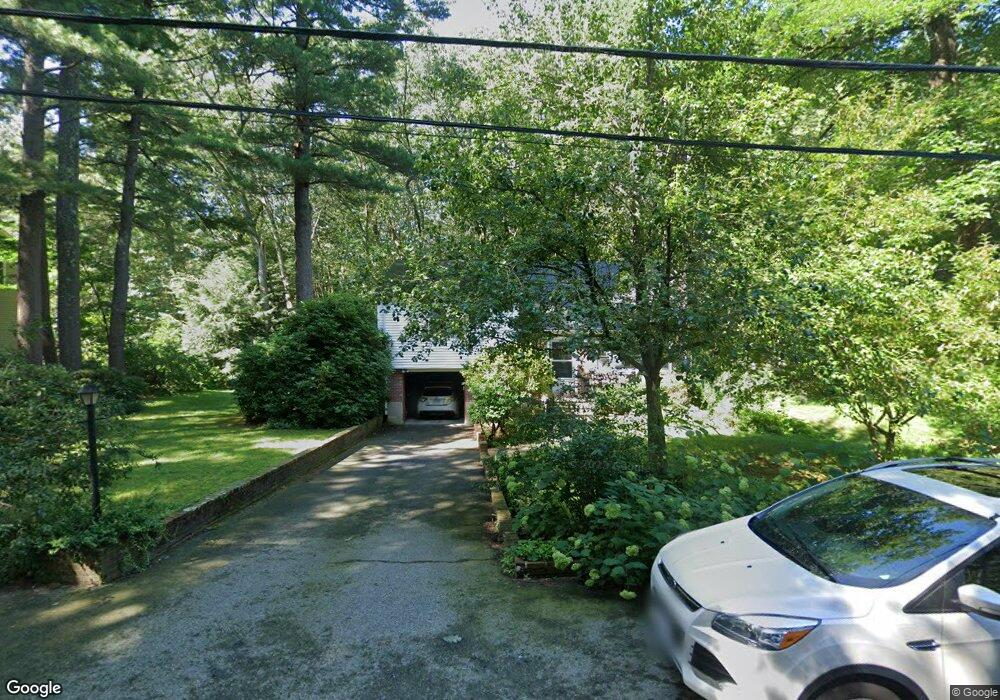
45 Maiden Ln Wayland, MA 01778
Estimated Value: $828,000 - $893,520
3
Beds
2
Baths
1,358
Sq Ft
$634/Sq Ft
Est. Value
About This Home
This home is located at 45 Maiden Ln, Wayland, MA 01778 and is currently estimated at $860,760, approximately $633 per square foot. 45 Maiden Ln is a home located in Middlesex County with nearby schools including Wayland High School and Veritas Christian Academy.
Ownership History
Date
Name
Owned For
Owner Type
Purchase Details
Closed on
Jan 23, 2013
Sold by
Wojcik Bernice C Est
Bought by
Wojcik Carl J
Current Estimated Value
Home Financials for this Owner
Home Financials are based on the most recent Mortgage that was taken out on this home.
Original Mortgage
$281,250
Outstanding Balance
$195,371
Interest Rate
3.35%
Mortgage Type
New Conventional
Estimated Equity
$665,389
Create a Home Valuation Report for This Property
The Home Valuation Report is an in-depth analysis detailing your home's value as well as a comparison with similar homes in the area
Home Values in the Area
Average Home Value in this Area
Purchase History
| Date | Buyer | Sale Price | Title Company |
|---|---|---|---|
| Wojcik Carl J | $375,000 | -- | |
| Wojcik Carl J | $375,000 | -- | |
| Wojcik Carl J | $375,000 | -- |
Source: Public Records
Mortgage History
| Date | Status | Borrower | Loan Amount |
|---|---|---|---|
| Open | Wojcik Carl J | $281,250 | |
| Closed | Wojcik Carl J | $281,250 |
Source: Public Records
Tax History Compared to Growth
Tax History
| Year | Tax Paid | Tax Assessment Tax Assessment Total Assessment is a certain percentage of the fair market value that is determined by local assessors to be the total taxable value of land and additions on the property. | Land | Improvement |
|---|---|---|---|---|
| 2025 | $11,565 | $739,900 | $480,000 | $259,900 |
| 2024 | $10,946 | $705,300 | $457,100 | $248,200 |
| 2023 | $10,619 | $637,800 | $415,500 | $222,300 |
| 2022 | $10,059 | $548,200 | $344,100 | $204,100 |
| 2021 | $0 | $510,400 | $312,800 | $197,600 |
| 2020 | $9,157 | $515,600 | $312,800 | $202,800 |
| 2019 | $8,932 | $488,600 | $297,900 | $190,700 |
| 2018 | $1,782,326 | $459,100 | $297,900 | $161,200 |
| 2017 | $8,023 | $442,300 | $283,600 | $158,700 |
| 2016 | $7,441 | $429,100 | $278,000 | $151,100 |
| 2015 | $7,819 | $425,200 | $278,000 | $147,200 |
Source: Public Records
Map
Nearby Homes
- 47 Pequot Rd
- 22 Lakeshore Dr
- 37 Pequot Rd
- 96 Lakeshore Dr
- 96 Lake Shore Dr
- 353 Old Connecticut Path
- 108 Dudley Rd
- 123 Dudley Rd
- 26 Dudley Rd
- 15 Crest Rd
- 260 Cochituate Rd
- 35 Wallace Rd
- 233 Lakeshore Dr
- 208 Cochituate Rd
- 454 Old Connecticut Path
- 3 Keith Rd
- 28 Joyce Rd
- 15 Parkridge Rd
- 177 Main St
- 11 White Pine Knoll Rd