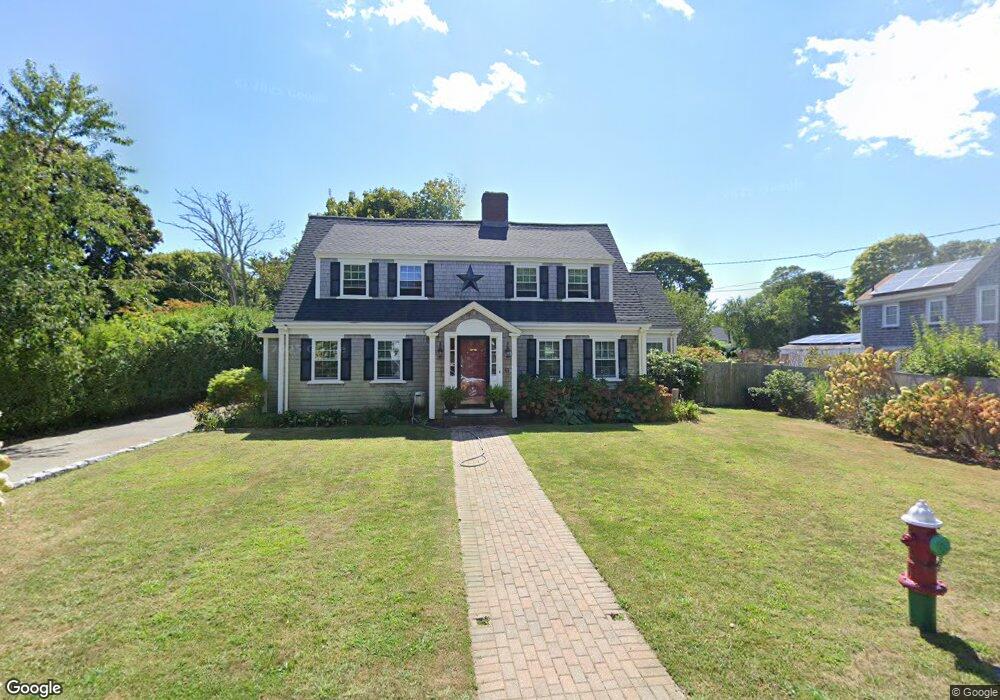
45 Maple Ave Unit 1 Hyannis, MA 02601
Estimated Value: $620,350 - $784,000
3
Beds
2
Baths
1,801
Sq Ft
$393/Sq Ft
Est. Value
About This Home
This home is located at 45 Maple Ave Unit 1, Hyannis, MA 02601 and is currently estimated at $707,338, approximately $392 per square foot. 45 Maple Ave Unit 1 is a home located in Barnstable County with nearby schools including Hyannis West Elementary School, Barnstable United Elementary School, and Barnstable Intermediate School.
Ownership History
Date
Name
Owned For
Owner Type
Purchase Details
Closed on
Nov 17, 2019
Sold by
Buckley Michael J
Bought by
Force Michael and Force Shane M
Current Estimated Value
Purchase Details
Closed on
Jul 14, 2011
Sold by
Specht Shane L and Specht Ann M
Bought by
Buckley Michael J
Home Financials for this Owner
Home Financials are based on the most recent Mortgage that was taken out on this home.
Original Mortgage
$220,000
Interest Rate
4.58%
Mortgage Type
Purchase Money Mortgage
Purchase Details
Closed on
Apr 30, 2007
Sold by
Specht Ann M and Susce Ann M
Bought by
Specht Ann M
Purchase Details
Closed on
Jul 31, 2000
Sold by
Iacomini Maryellen
Bought by
Susce Ann M
Purchase Details
Closed on
Sep 9, 1996
Sold by
Visone Joseph A and Visone Katherine M
Bought by
Iacomini Mary Ellen
Purchase Details
Closed on
May 18, 1989
Sold by
Hodge Persis C
Bought by
Visone Joseph A
Create a Home Valuation Report for This Property
The Home Valuation Report is an in-depth analysis detailing your home's value as well as a comparison with similar homes in the area
Home Values in the Area
Average Home Value in this Area
Purchase History
| Date | Buyer | Sale Price | Title Company |
|---|---|---|---|
| Force Michael | -- | -- | |
| Buckley Michael J | $280,000 | -- | |
| Specht Ann M | -- | -- | |
| Susce Ann M | $179,900 | -- | |
| Iacomini Mary Ellen | $107,000 | -- | |
| Visone Joseph A | $144,750 | -- |
Source: Public Records
Mortgage History
| Date | Status | Borrower | Loan Amount |
|---|---|---|---|
| Previous Owner | Buckley Michael J | $220,000 | |
| Previous Owner | Visone Joseph A | $236,000 | |
| Previous Owner | Visone Joseph A | $236,000 |
Source: Public Records
Tax History
| Year | Tax Paid | Tax Assessment Tax Assessment Total Assessment is a certain percentage of the fair market value that is determined by local assessors to be the total taxable value of land and additions on the property. | Land | Improvement |
|---|---|---|---|---|
| 2025 | $5,217 | $562,800 | $142,000 | $420,800 |
| 2024 | $5,100 | $563,500 | $142,000 | $421,500 |
| 2023 | $4,684 | $489,400 | $129,100 | $360,300 |
| 2022 | $4,582 | $396,000 | $95,600 | $300,400 |
| 2021 | $4,136 | $347,300 | $95,600 | $251,700 |
| 2020 | $3,878 | $314,500 | $95,600 | $218,900 |
| 2019 | $3,658 | $290,800 | $95,600 | $195,200 |
| 2018 | $3,159 | $256,800 | $100,600 | $156,200 |
| 2017 | $3,011 | $251,100 | $100,600 | $150,500 |
| 2016 | $2,993 | $255,200 | $104,700 | $150,500 |
| 2015 | $3,139 | $271,300 | $98,500 | $172,800 |
Source: Public Records
Map
Nearby Homes
- 125 Sea St
- 138 Chase St
- 97 Bassett Ln
- 135 W Main St Unit 7
- 287 Ocean St Unit C2
- 287 Ocean St Unit 2 BLDG C
- 50 Redwood Ln
- 432 Sea St Unit 8D
- 432 Sea St Unit 8D
- 54 Murphy Rd
- 55 Louis St
- 292 Megan Rd
- 78 Bristol Ave
- 25 Ripple Cove Rd
- 14 Marston Ave
- 72 Grove St
- 35 Pleasant St
- 500 Ocean St Unit 152
- 68 Center St Unit 13
- 15 Glen Rd
Your Personal Tour Guide
Ask me questions while you tour the home.