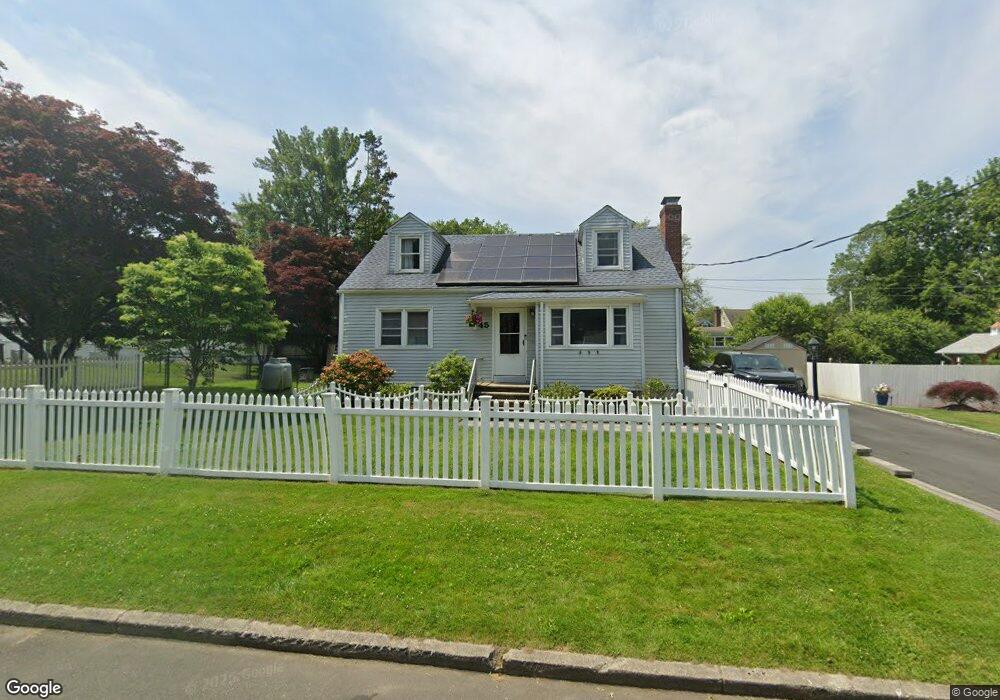
45 Marino Dr Milford, CT 06460
East Milford NeighborhoodEstimated Value: $484,000 - $523,000
4
Beds
3
Baths
1,613
Sq Ft
$312/Sq Ft
Est. Value
About This Home
This home is located at 45 Marino Dr, Milford, CT 06460 and is currently estimated at $503,590, approximately $312 per square foot. 45 Marino Dr is a home located in New Haven County with nearby schools including Orchard Hills School, East Shore Middle School, and Joseph A. Foran High School.
Ownership History
Date
Name
Owned For
Owner Type
Purchase Details
Closed on
Oct 26, 2007
Sold by
Coleman Stacy L
Bought by
Lee Tara E
Current Estimated Value
Home Financials for this Owner
Home Financials are based on the most recent Mortgage that was taken out on this home.
Original Mortgage
$255,200
Interest Rate
6.39%
Purchase Details
Closed on
Mar 16, 2004
Sold by
Fallon Thomas J and Fallon Loretta J
Bought by
Coleman Tobin
Purchase Details
Closed on
Aug 3, 1999
Sold by
Cusack William S and Whelan-Cusack Dana
Bought by
Fallon Thomas J and Fallon Loretta J
Purchase Details
Closed on
Jun 26, 1997
Sold by
Pelletier Philip D and Pelletier Jeannette R
Bought by
Cusack William S and Whealn-Cusack Dana
Create a Home Valuation Report for This Property
The Home Valuation Report is an in-depth analysis detailing your home's value as well as a comparison with similar homes in the area
Home Values in the Area
Average Home Value in this Area
Purchase History
| Date | Buyer | Sale Price | Title Company |
|---|---|---|---|
| Lee Tara E | $319,000 | -- | |
| Lee Tara E | $319,000 | -- | |
| Coleman Tobin | $259,900 | -- | |
| Coleman Tobin | $259,900 | -- | |
| Fallon Thomas J | $177,000 | -- | |
| Fallon Thomas J | $177,000 | -- | |
| Cusack William S | $165,000 | -- | |
| Cusack William S | $165,000 | -- |
Source: Public Records
Mortgage History
| Date | Status | Borrower | Loan Amount |
|---|---|---|---|
| Open | Cusack William S | $245,000 | |
| Closed | Cusack William S | $255,200 |
Source: Public Records
Tax History Compared to Growth
Tax History
| Year | Tax Paid | Tax Assessment Tax Assessment Total Assessment is a certain percentage of the fair market value that is determined by local assessors to be the total taxable value of land and additions on the property. | Land | Improvement |
|---|---|---|---|---|
| 2025 | $6,984 | $236,330 | $98,960 | $137,370 |
| 2024 | $6,887 | $236,330 | $98,960 | $137,370 |
| 2023 | $6,421 | $236,330 | $98,960 | $137,370 |
| 2022 | $6,298 | $236,330 | $98,960 | $137,370 |
| 2021 | $5,414 | $195,800 | $69,300 | $126,500 |
| 2020 | $5,420 | $195,800 | $69,300 | $126,500 |
| 2019 | $5,426 | $195,800 | $69,300 | $126,500 |
| 2018 | $5,431 | $195,800 | $69,300 | $126,500 |
| 2017 | $5,441 | $195,800 | $69,300 | $126,500 |
| 2016 | $5,585 | $200,600 | $69,300 | $131,300 |
| 2015 | $5,593 | $200,600 | $69,300 | $131,300 |
| 2014 | $5,460 | $200,600 | $69,300 | $131,300 |
Source: Public Records
Map
Nearby Homes
- 35 Pauline St
- 37 Morris Ln
- 44 Clark Hill Rd
- 126 Baxter Ln
- 822 New Haven Ave
- 75 Long Island View Rd
- 15 Alpha St
- 25 Carmen Rd
- 404 Buckingham Ave
- 342 New Haven Ave
- 470 Pond Point Ave
- 44 Chester St
- 19 Knollwood Rd
- 105 Carriage Path S Unit 105 Carriage Path So
- 565 Pond Point Ave
- 571 Pond Point Ave
- 1080 New Haven Ave Unit 113
- 5 Vine St
- 180 Melba St Unit 205
- 25 Summer Place