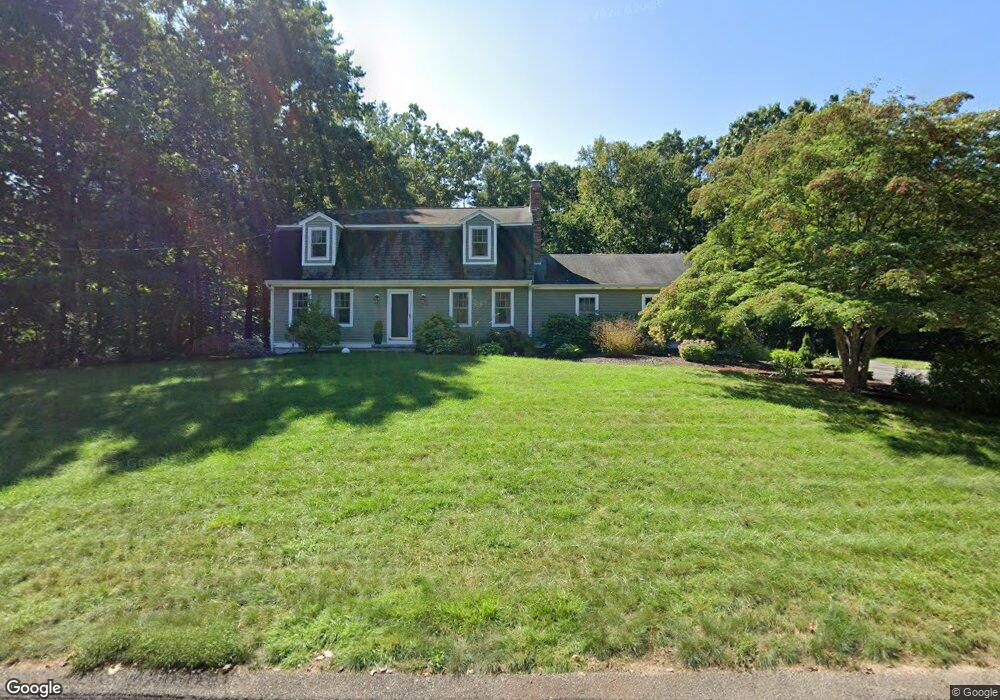
45 Metacomet St Wrentham, MA 02093
Estimated Value: $674,000 - $858,000
3
Beds
2
Baths
2,016
Sq Ft
$374/Sq Ft
Est. Value
About This Home
This home is located at 45 Metacomet St, Wrentham, MA 02093 and is currently estimated at $753,020, approximately $373 per square foot. 45 Metacomet St is a home located in Norfolk County with nearby schools including Delaney Elementary School and Charles E Roderick.
Ownership History
Date
Name
Owned For
Owner Type
Purchase Details
Closed on
Jul 15, 2021
Sold by
Khung Brian N and Khung Karen M
Bought by
Kung Ret
Current Estimated Value
Purchase Details
Closed on
Jul 31, 1995
Sold by
Diezemann James G and Diezemann Amy S
Bought by
Khung Brian N and Khung Karen M
Home Financials for this Owner
Home Financials are based on the most recent Mortgage that was taken out on this home.
Original Mortgage
$168,800
Interest Rate
7.56%
Mortgage Type
Purchase Money Mortgage
Purchase Details
Closed on
Jan 26, 1995
Sold by
Cafasso Edward and Cafasso Rosemary H
Bought by
Diezemann James G and Diezemann Amy S
Home Financials for this Owner
Home Financials are based on the most recent Mortgage that was taken out on this home.
Original Mortgage
$100,000
Interest Rate
9.24%
Mortgage Type
Purchase Money Mortgage
Purchase Details
Closed on
May 11, 1992
Sold by
Penk Walter E
Bought by
Cafasso Edward
Home Financials for this Owner
Home Financials are based on the most recent Mortgage that was taken out on this home.
Original Mortgage
$164,000
Interest Rate
8.91%
Mortgage Type
Purchase Money Mortgage
Purchase Details
Closed on
Apr 20, 1989
Sold by
Hamilton Michael S
Bought by
Penk Walter E
Create a Home Valuation Report for This Property
The Home Valuation Report is an in-depth analysis detailing your home's value as well as a comparison with similar homes in the area
Purchase History
We collect this data history from publicly available records. To have your information removed, we recommend requesting removal directly through your county’s website.
| Date | Buyer | Sale Price | Title Company |
|---|---|---|---|
| Kung Ret | -- | None Available | |
| Khung Brian N | $211,000 | -- | |
| Diezemann James G | $203,500 | -- | |
| Cafasso Edward | $184,250 | -- | |
| Penk Walter E | $217,500 | -- |
Source: Public Records
Mortgage History
We collect this data history from publicly available records. To have your information removed, we recommend requesting removal directly through your county’s website.
| Date | Status | Borrower | Loan Amount |
|---|---|---|---|
| Previous Owner | Penk Walter E | $168,800 | |
| Previous Owner | Penk Walter E | $100,000 | |
| Previous Owner | Penk Walter E | $163,150 | |
| Previous Owner | Penk Walter E | $164,000 |
Source: Public Records
Tax History
| Year | Tax Paid | Tax Assessment Tax Assessment Total Assessment is a certain percentage of the fair market value that is determined by local assessors to be the total taxable value of land and additions on the property. | Land | Improvement |
|---|---|---|---|---|
| 2025 | $7,409 | $639,300 | $314,300 | $325,000 |
| 2024 | $7,135 | $594,600 | $314,300 | $280,300 |
| 2023 | $7,186 | $569,400 | $285,800 | $283,600 |
| 2022 | $6,720 | $491,600 | $245,300 | $246,300 |
| 2021 | $7,034 | $499,900 | $257,800 | $242,100 |
| 2020 | $6,190 | $434,400 | $182,500 | $251,900 |
| 2019 | $6,245 | $442,300 | $190,400 | $251,900 |
| 2018 | $6,254 | $439,200 | $190,600 | $248,600 |
| 2017 | $6,110 | $428,800 | $186,900 | $241,900 |
| 2016 | $5,879 | $411,700 | $181,500 | $230,200 |
| 2015 | $5,761 | $384,600 | $174,500 | $210,100 |
| 2014 | $5,665 | $370,000 | $167,800 | $202,200 |
Source: Public Records
Map
Nearby Homes
- 18 A St
- 371 & 377 Franklin St
- 175 Pokanoket Path
- 11 Earle Stewart Ln Unit Lot 2
- 215 South St
- 278 South St
- 14 Earle Stewart Ln Unit Lot 3
- 300 Lafayette Ave
- 101 Bennett St
- 3 Oak View Terrace Unit 3
- 43 Maple St
- 107 Mill St
- 9 Elliot Mills Unit 5
- 8 Elliot Mills Unit 30
- 7 Elliot Mills Unit 4
- 10 Elliot Mills Unit 29
- 59 Geordan Ave
- 25 King St
- 19 King St
- 28 Waites Crossing
- 35 Metacomet St
- 55 Metacomet St
- 60 Gilmore Rd
- 50 Metacomet St
- 40 Metacomet St
- 25 Metacomet St
- 65 Metacomet St
- 30 Metacomet St
- 80 Gilmore Rd Unit 80
- 60 Metacomet St
- 100 Gilmore Rd
- 50 Gilmore Rd
- 15 Metacomet St
- 70 Metacomet St
- 71 Gilmore Rd
- 20 Metacomet St
- 75 Gilmore Rd
- 75 Metacomet St
- 55 Gilmore Rd
- 81 Gilmore Rd
Your Personal Tour Guide
Ask me questions while you tour the home.